The influence of environmental change on genetic diversity across spatial and
taxonomic scales
Connor French, PhD Candidate
Pre-defense seminar, 2024-06-04
The Graduate Center
City University of New York


![]()
![]()
![]()
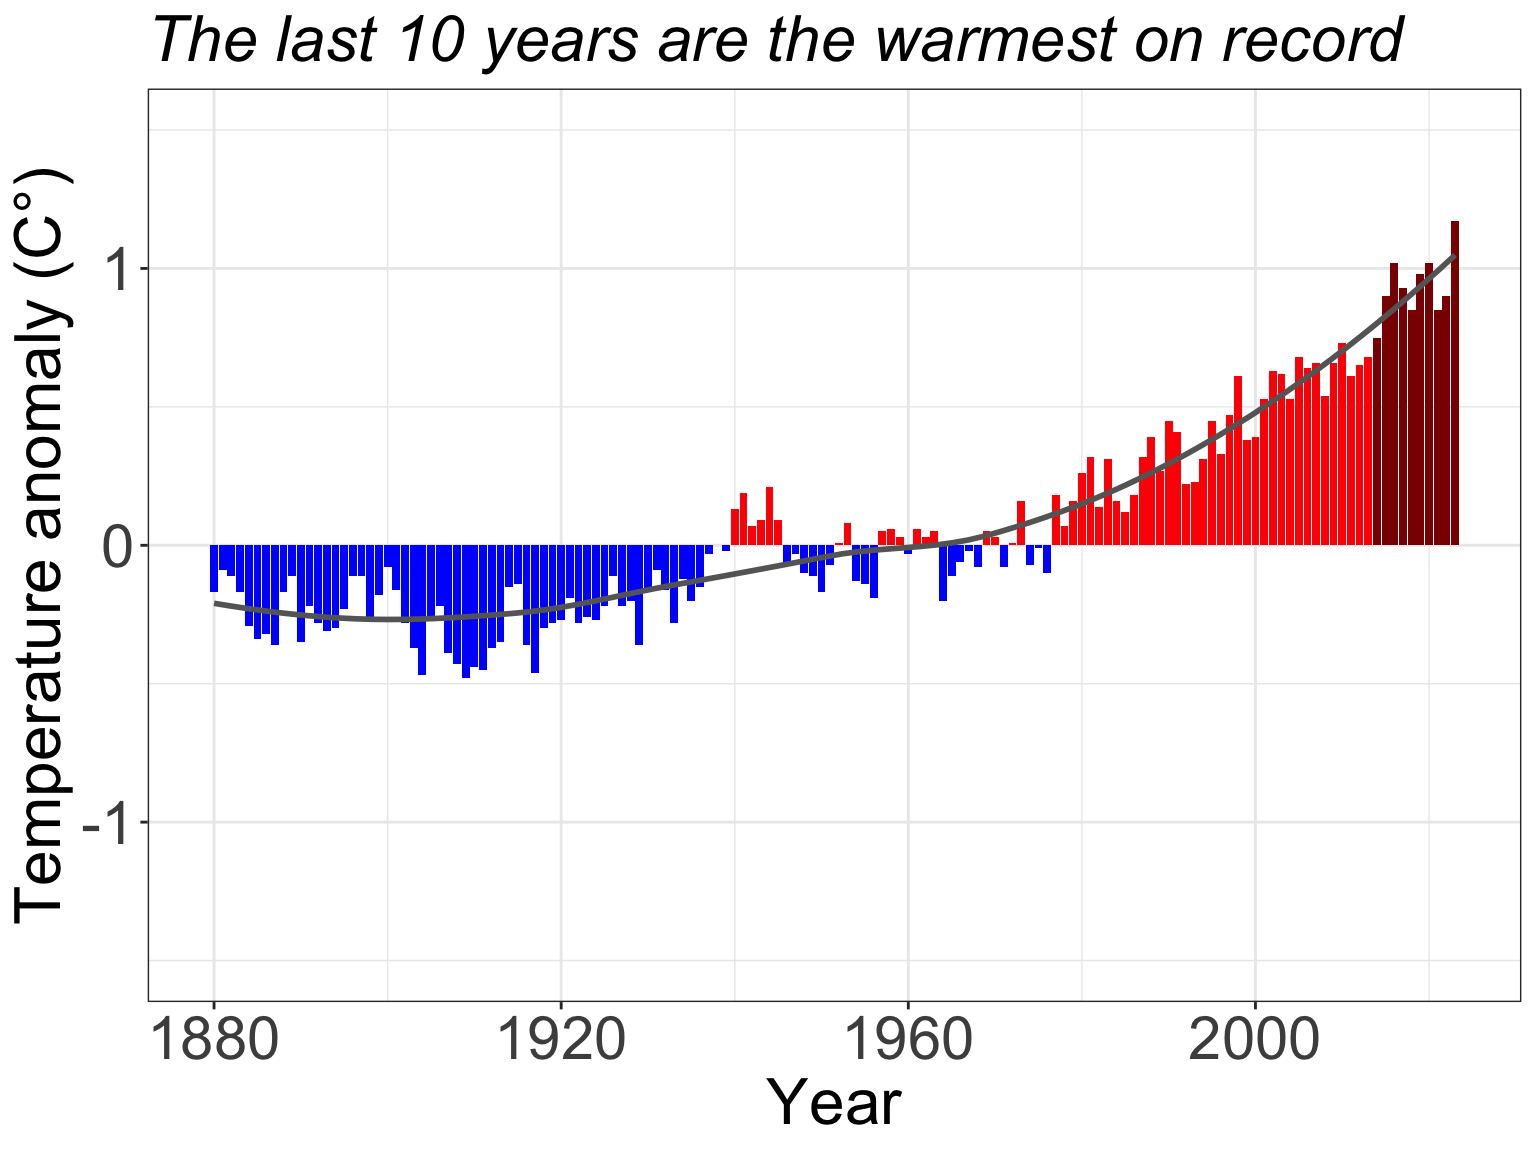
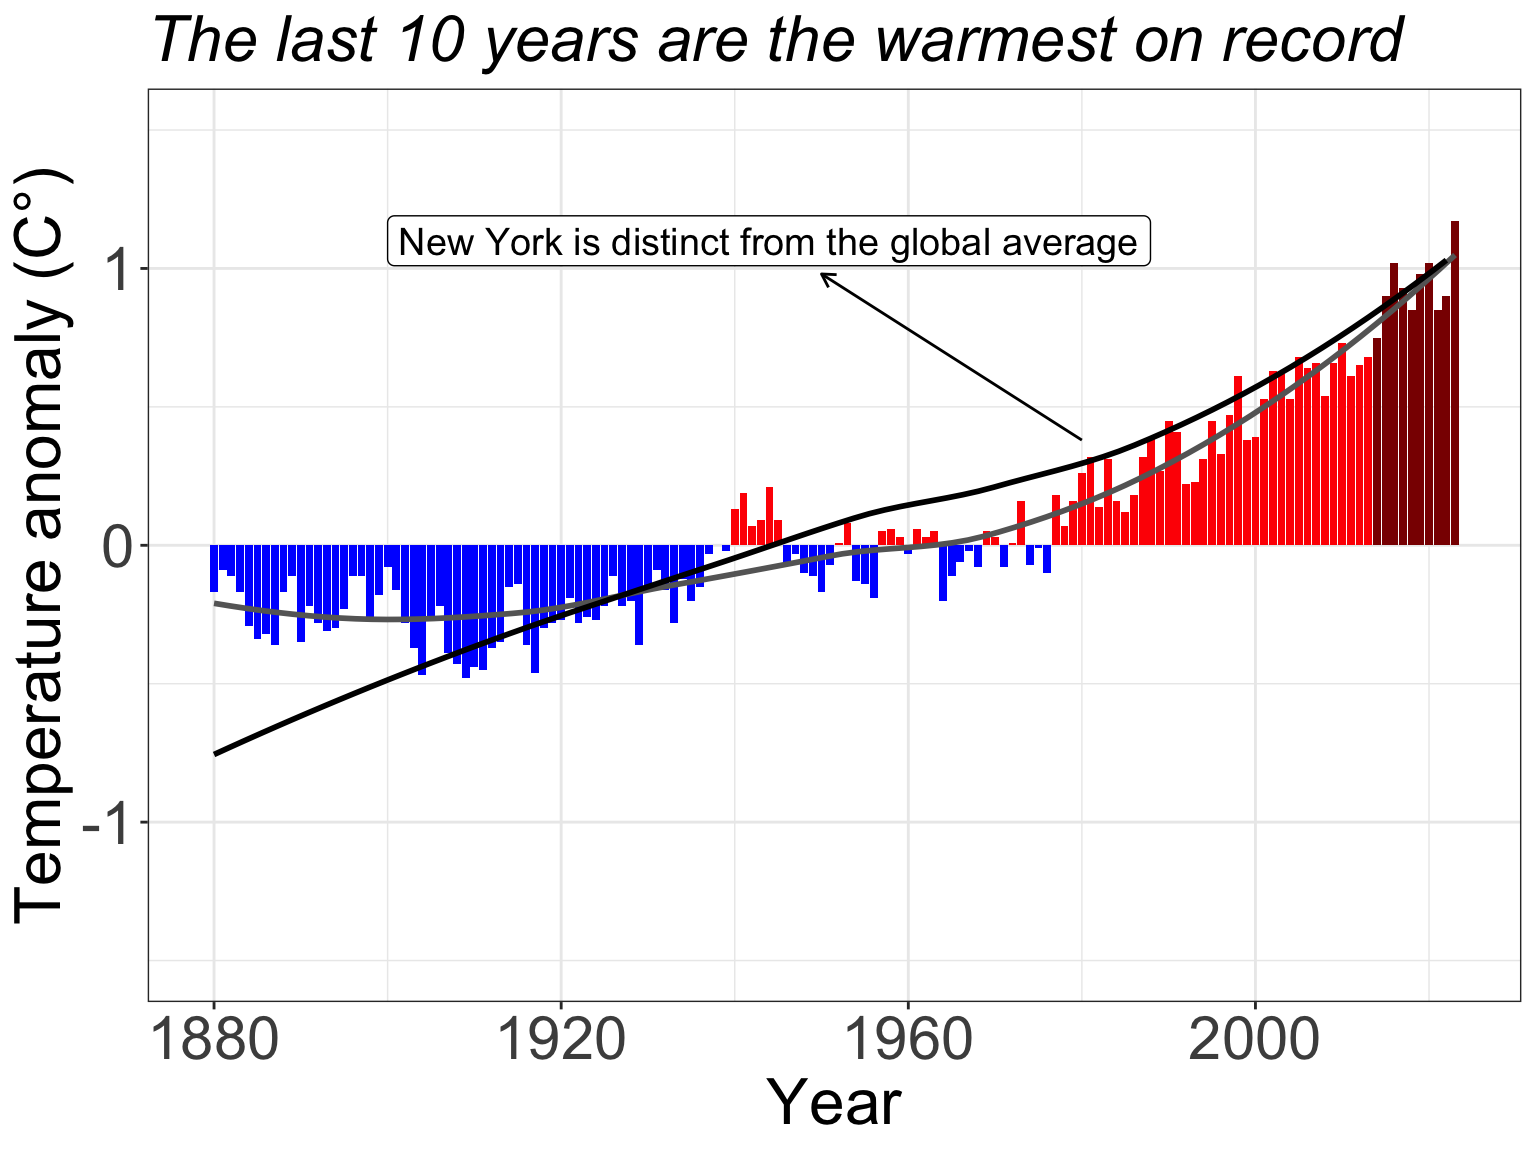
The Earth is constantly changing

Populations shrink or expand…

Fragment and reconnect…

Adapt or go extinct

Genetic diversity can tell stories about
Species
and Communities
 1
1
Understanding these stories is especially urgent
Understanding these stories is especially urgent
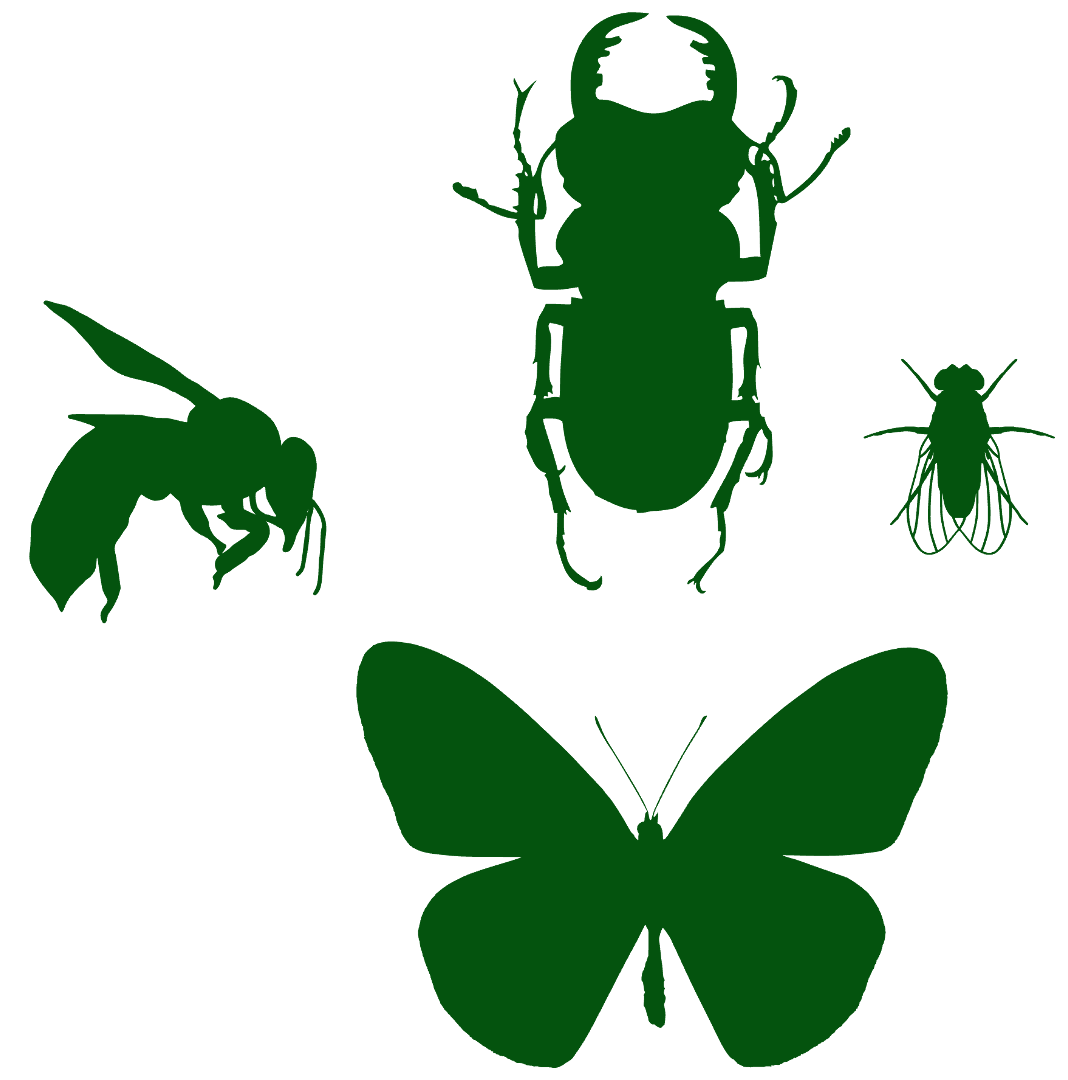
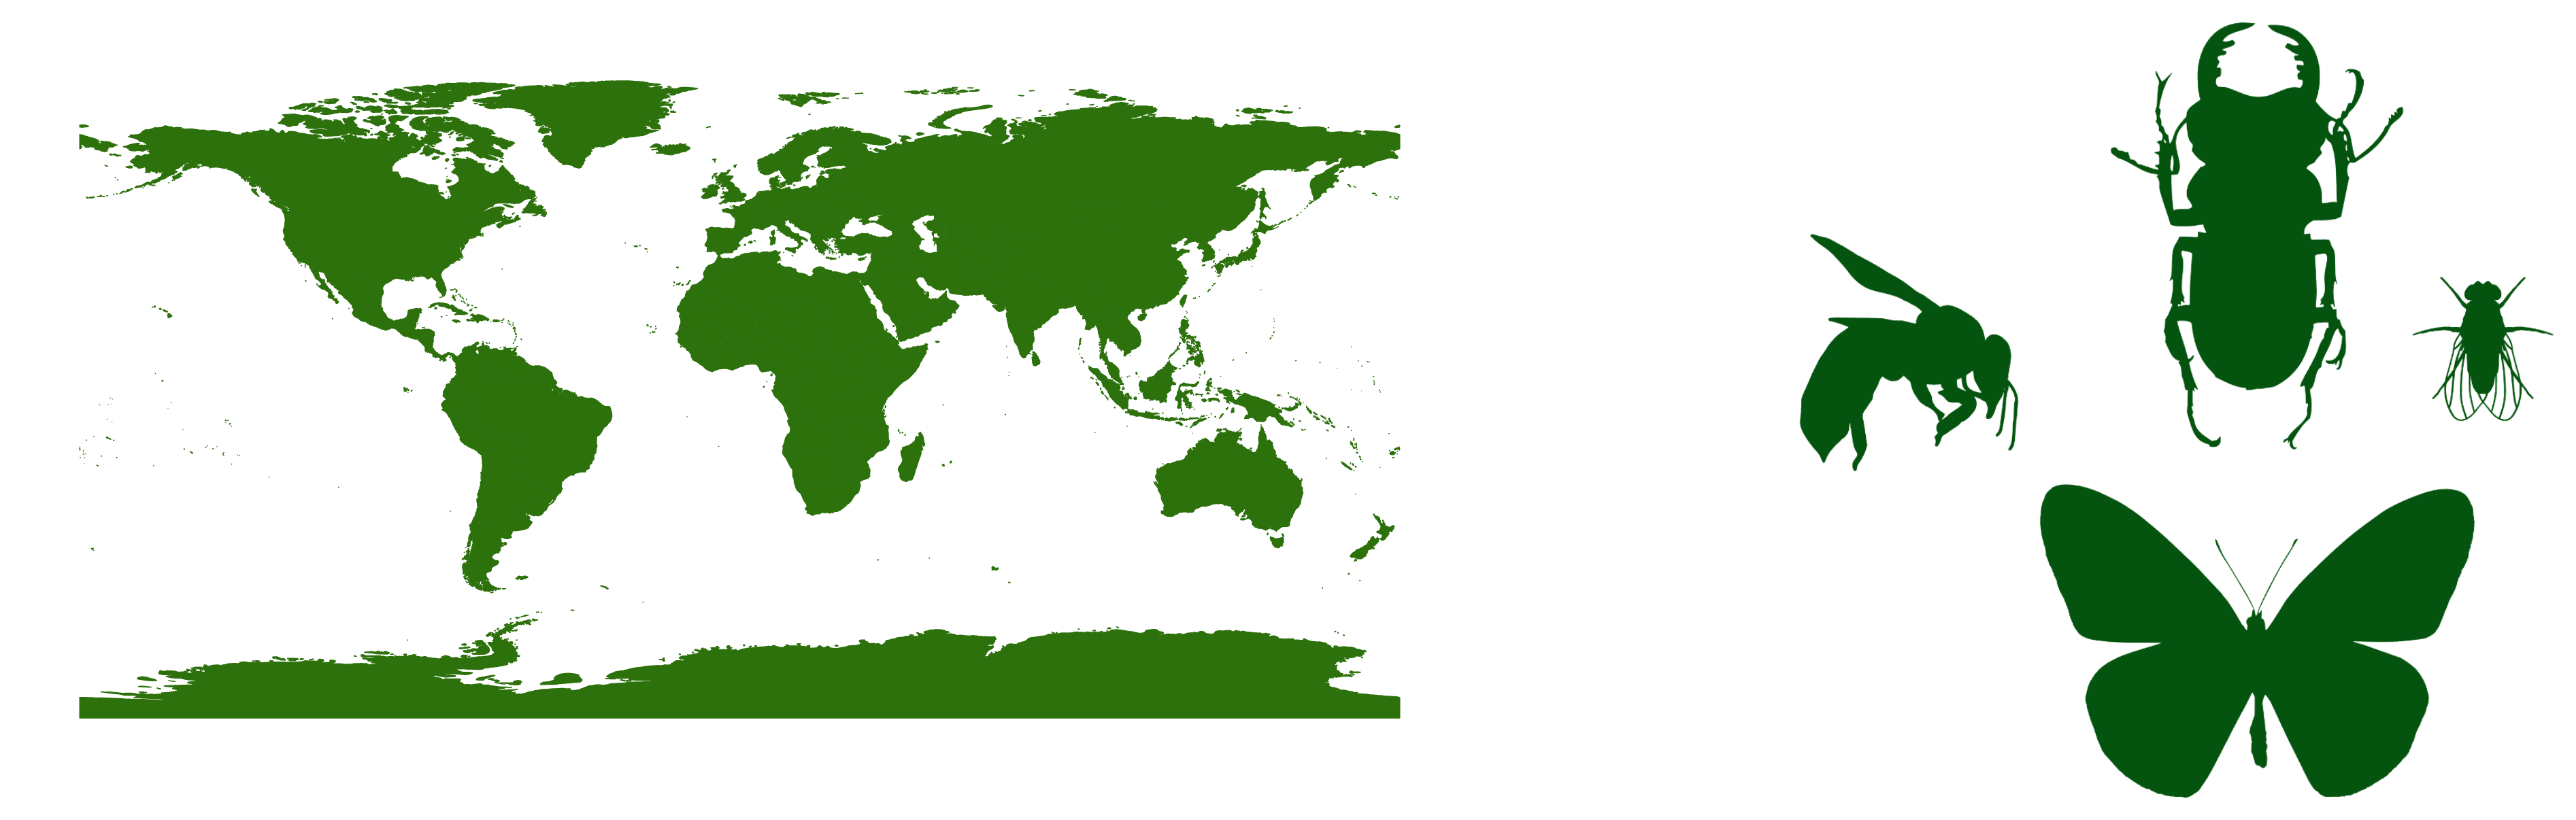
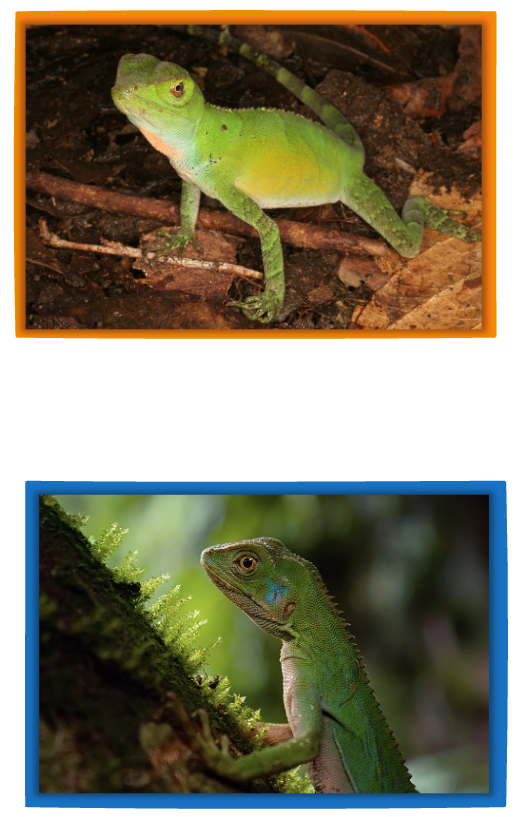
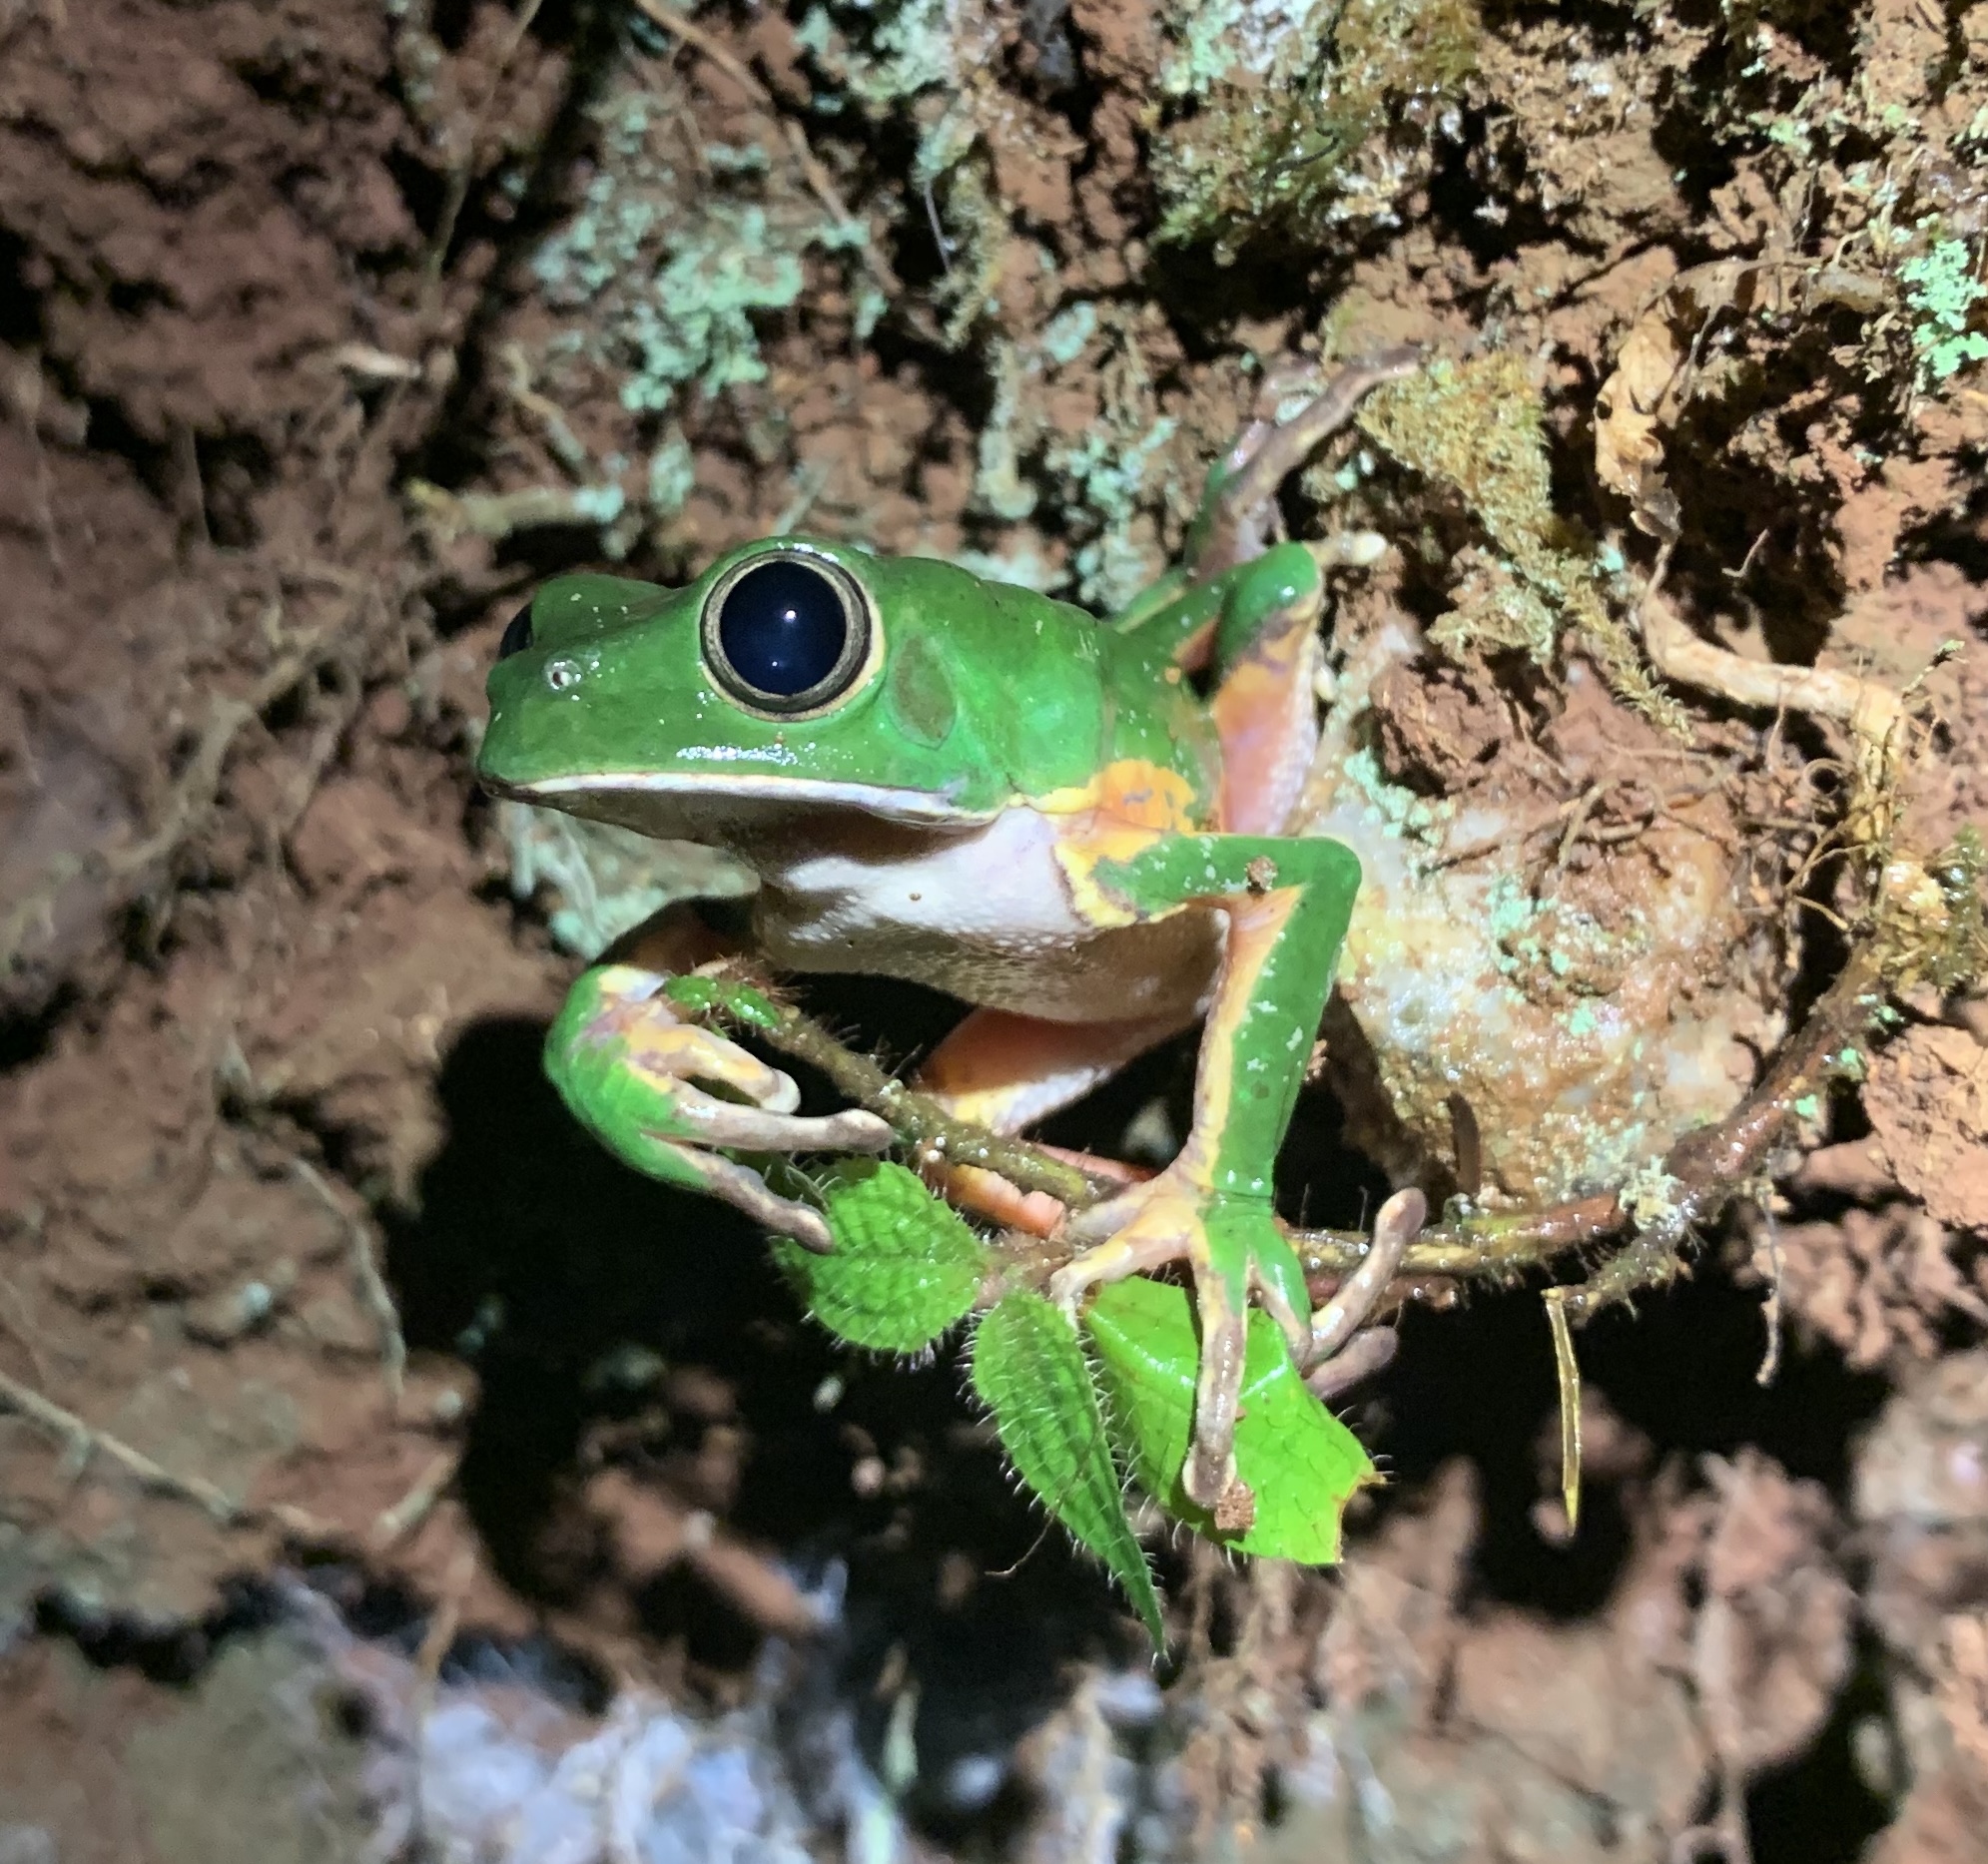
Ectotherms are linked to their environments
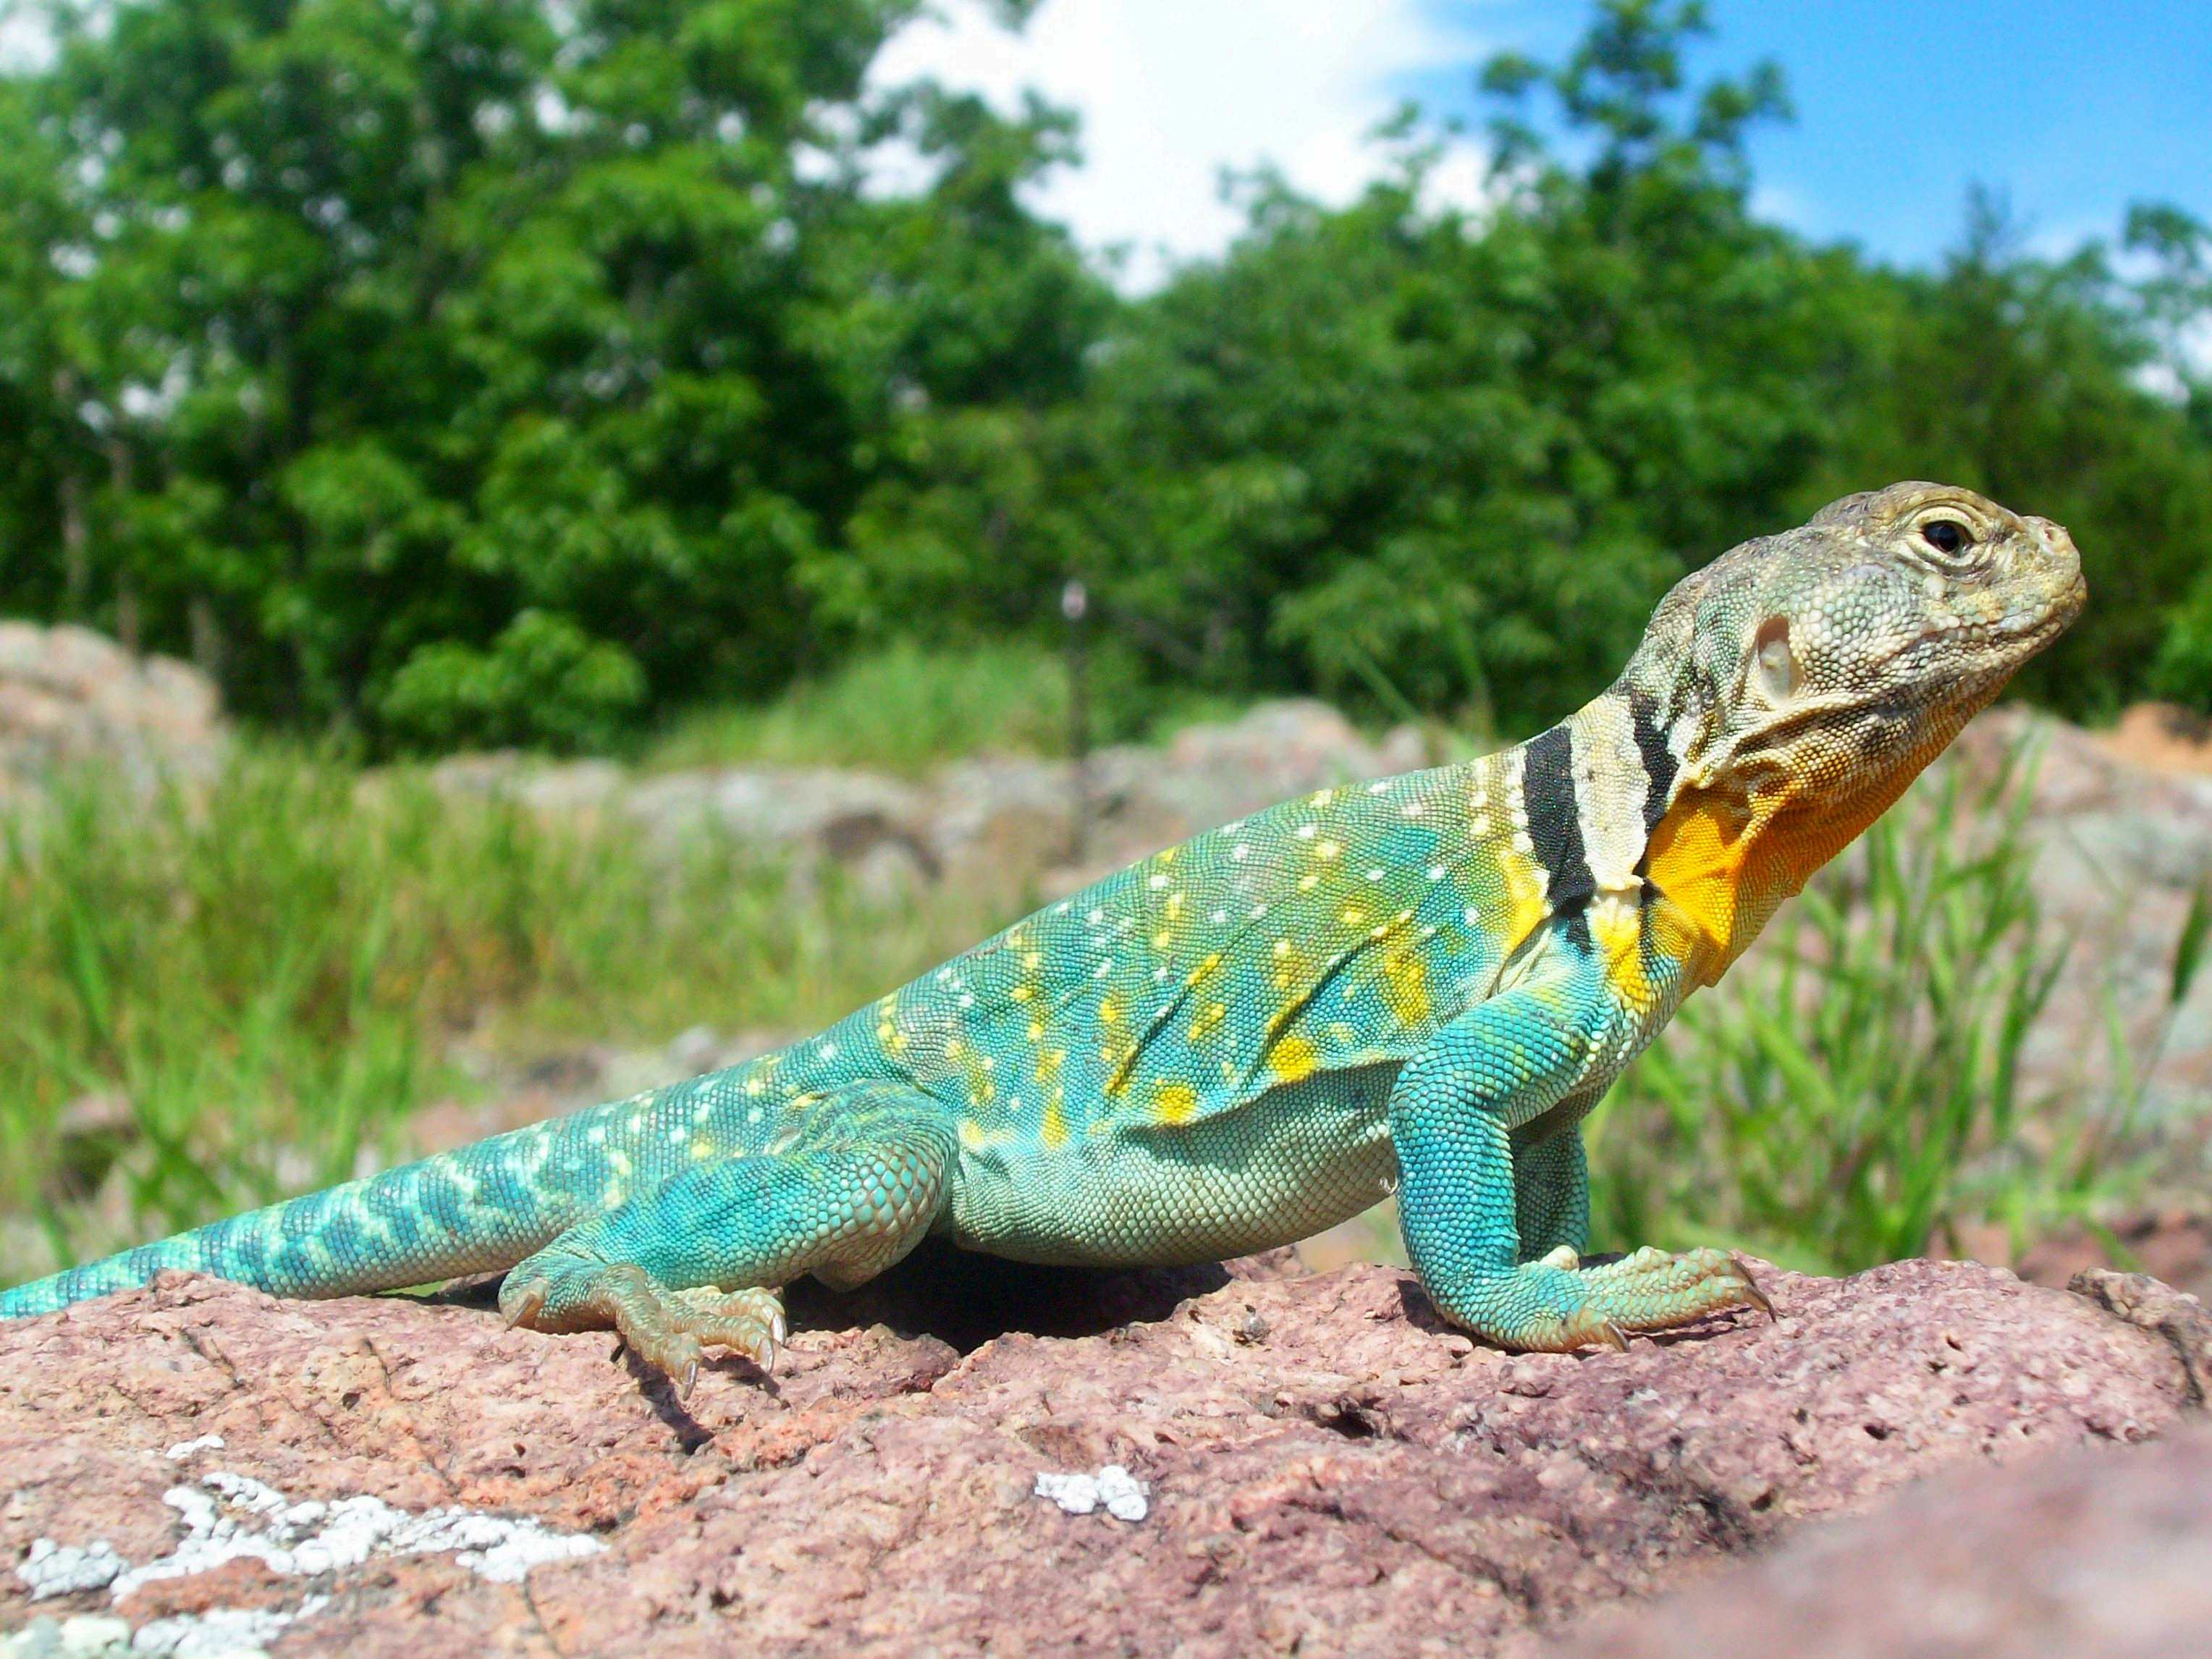
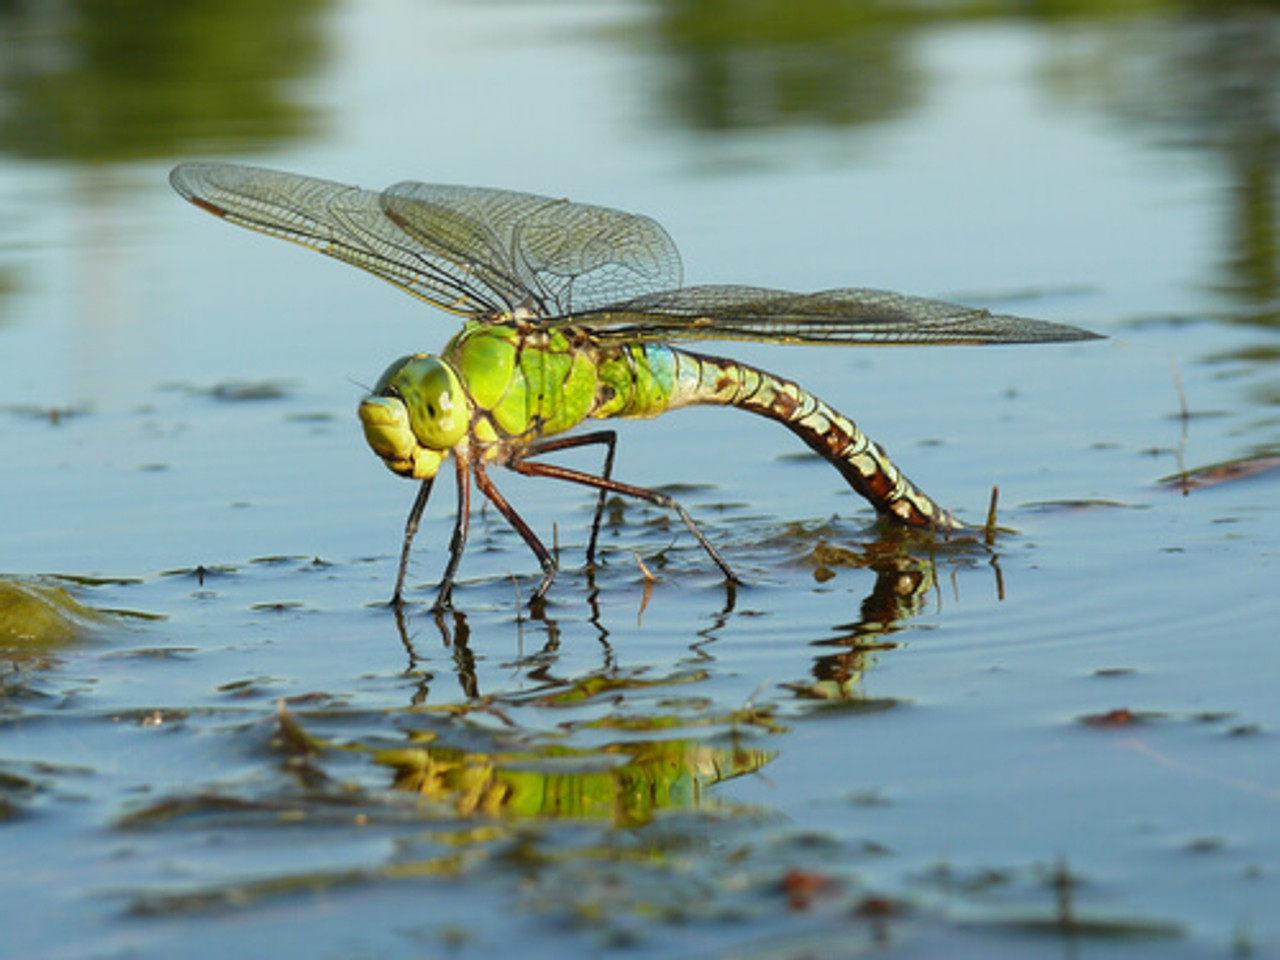
I investigate global and regional patterns of genetic diversity in two groups of ectotherms, insects and lizards, to understand the relationship between environmental change and genetic diversity, from populations to assemblages.


Global determinants of insect mitochondrial genetic diversity
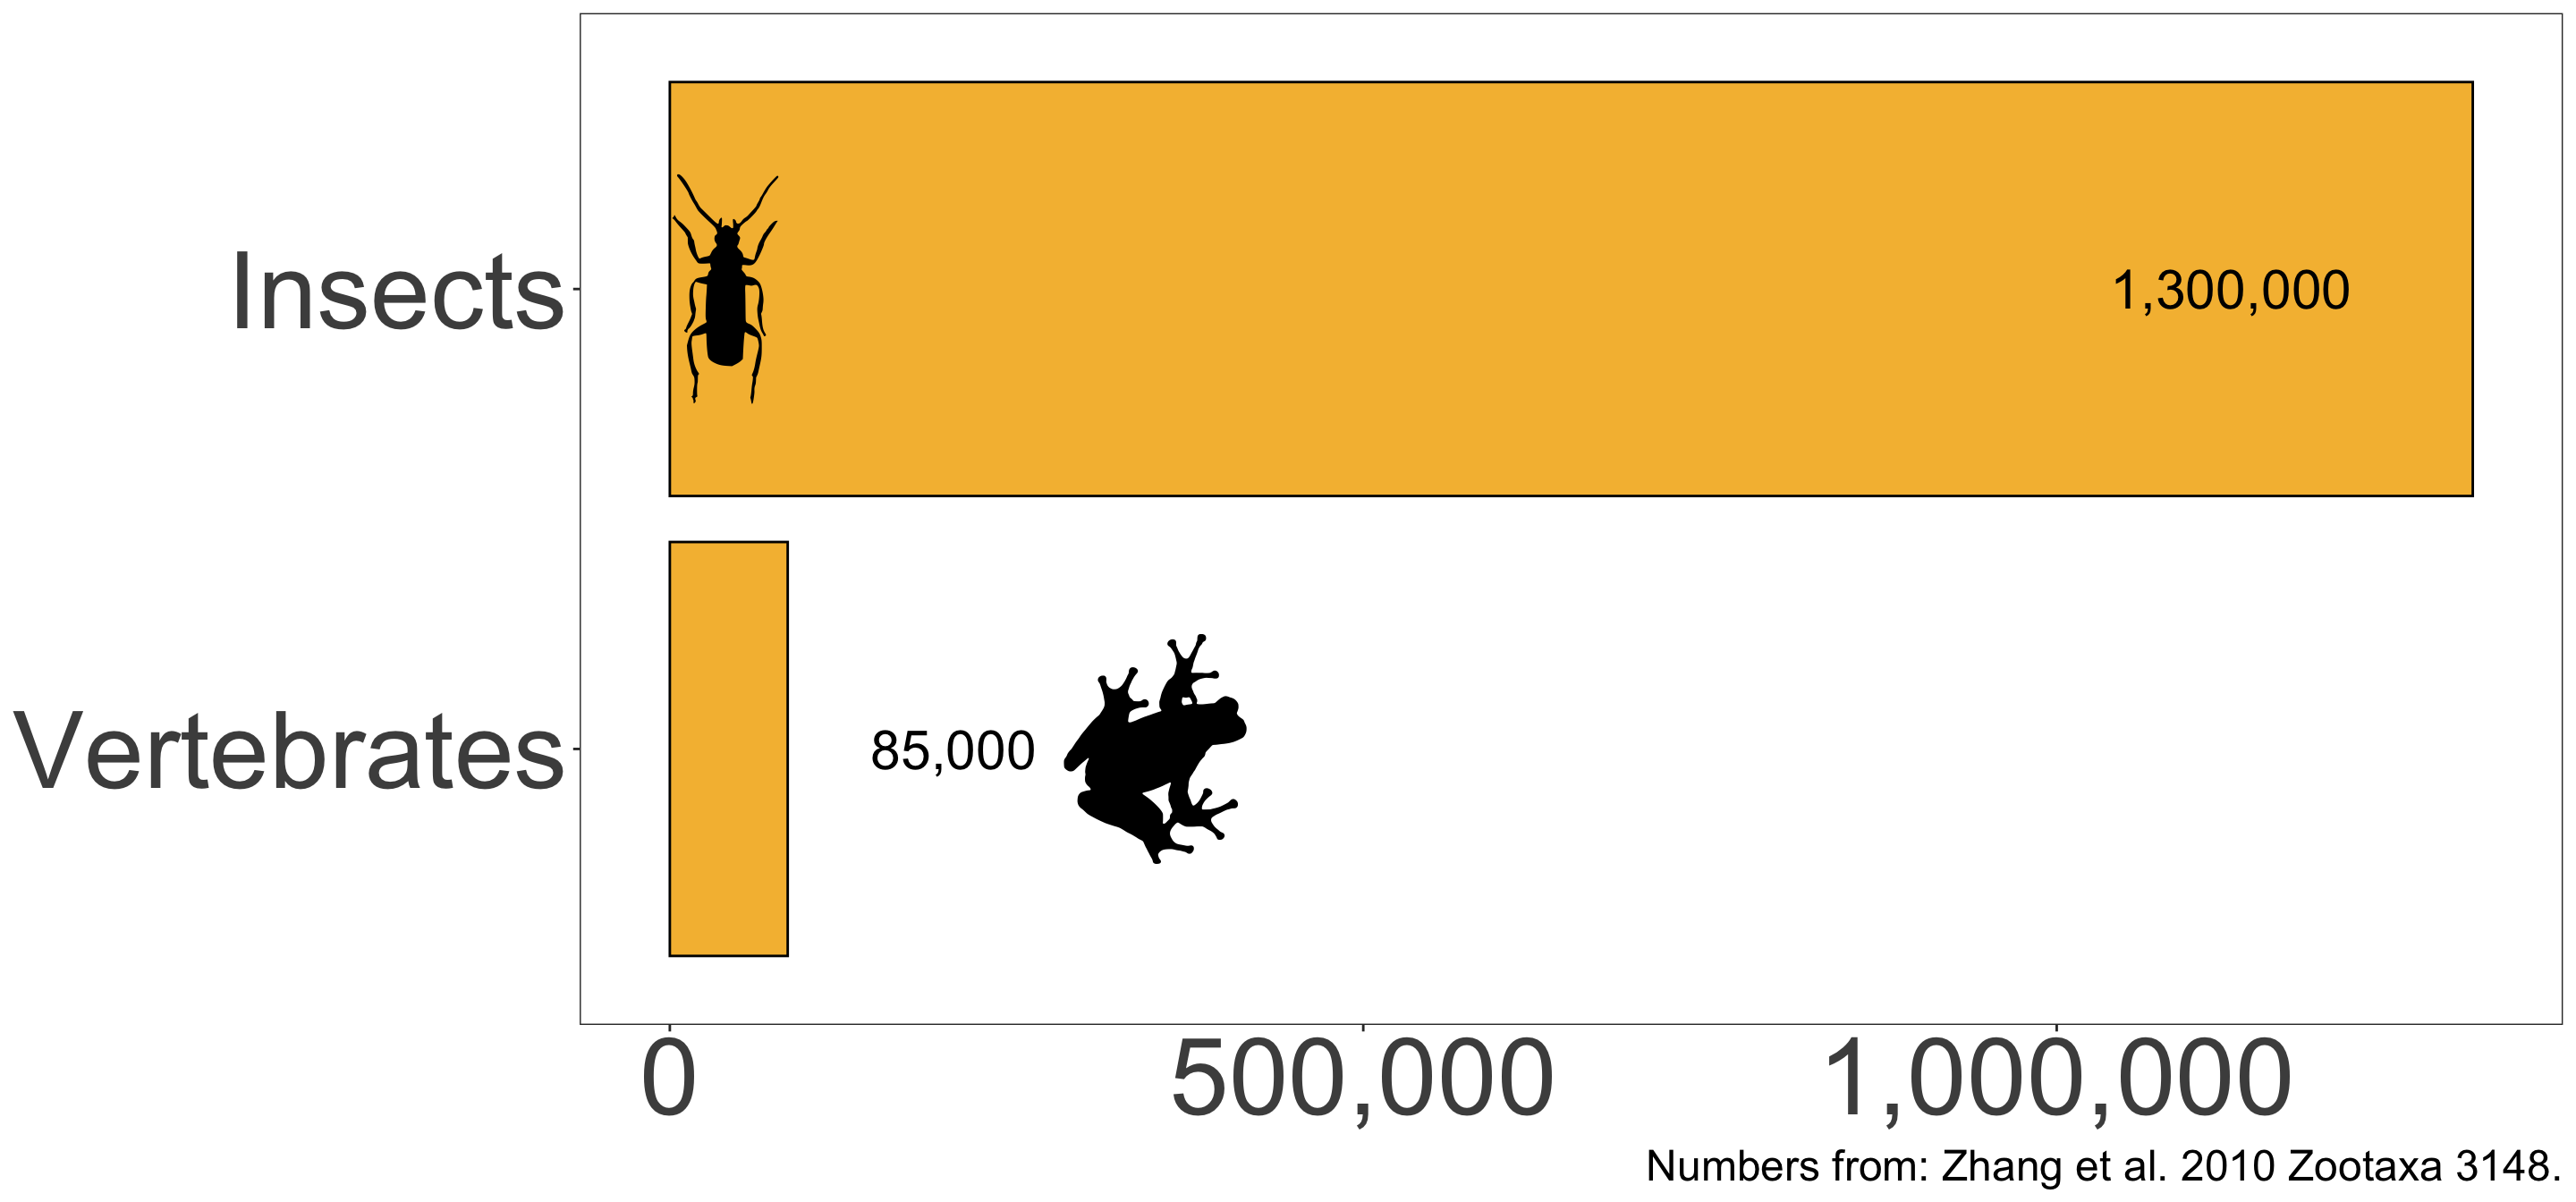
A global perspective is necessary

Insects comprise over 93% of the planet’s described animal diversity
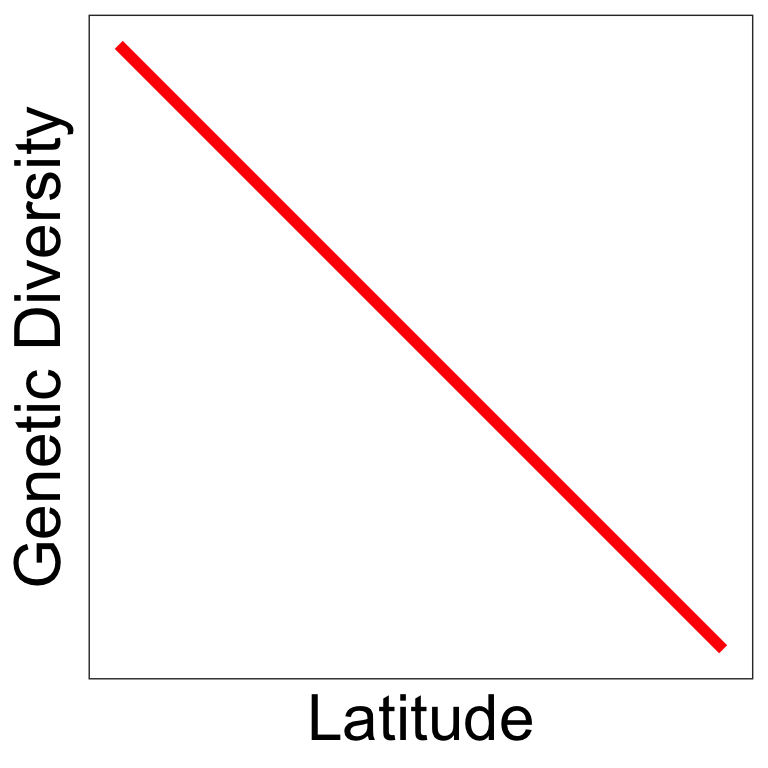
Some predictions follow those from vertebrates
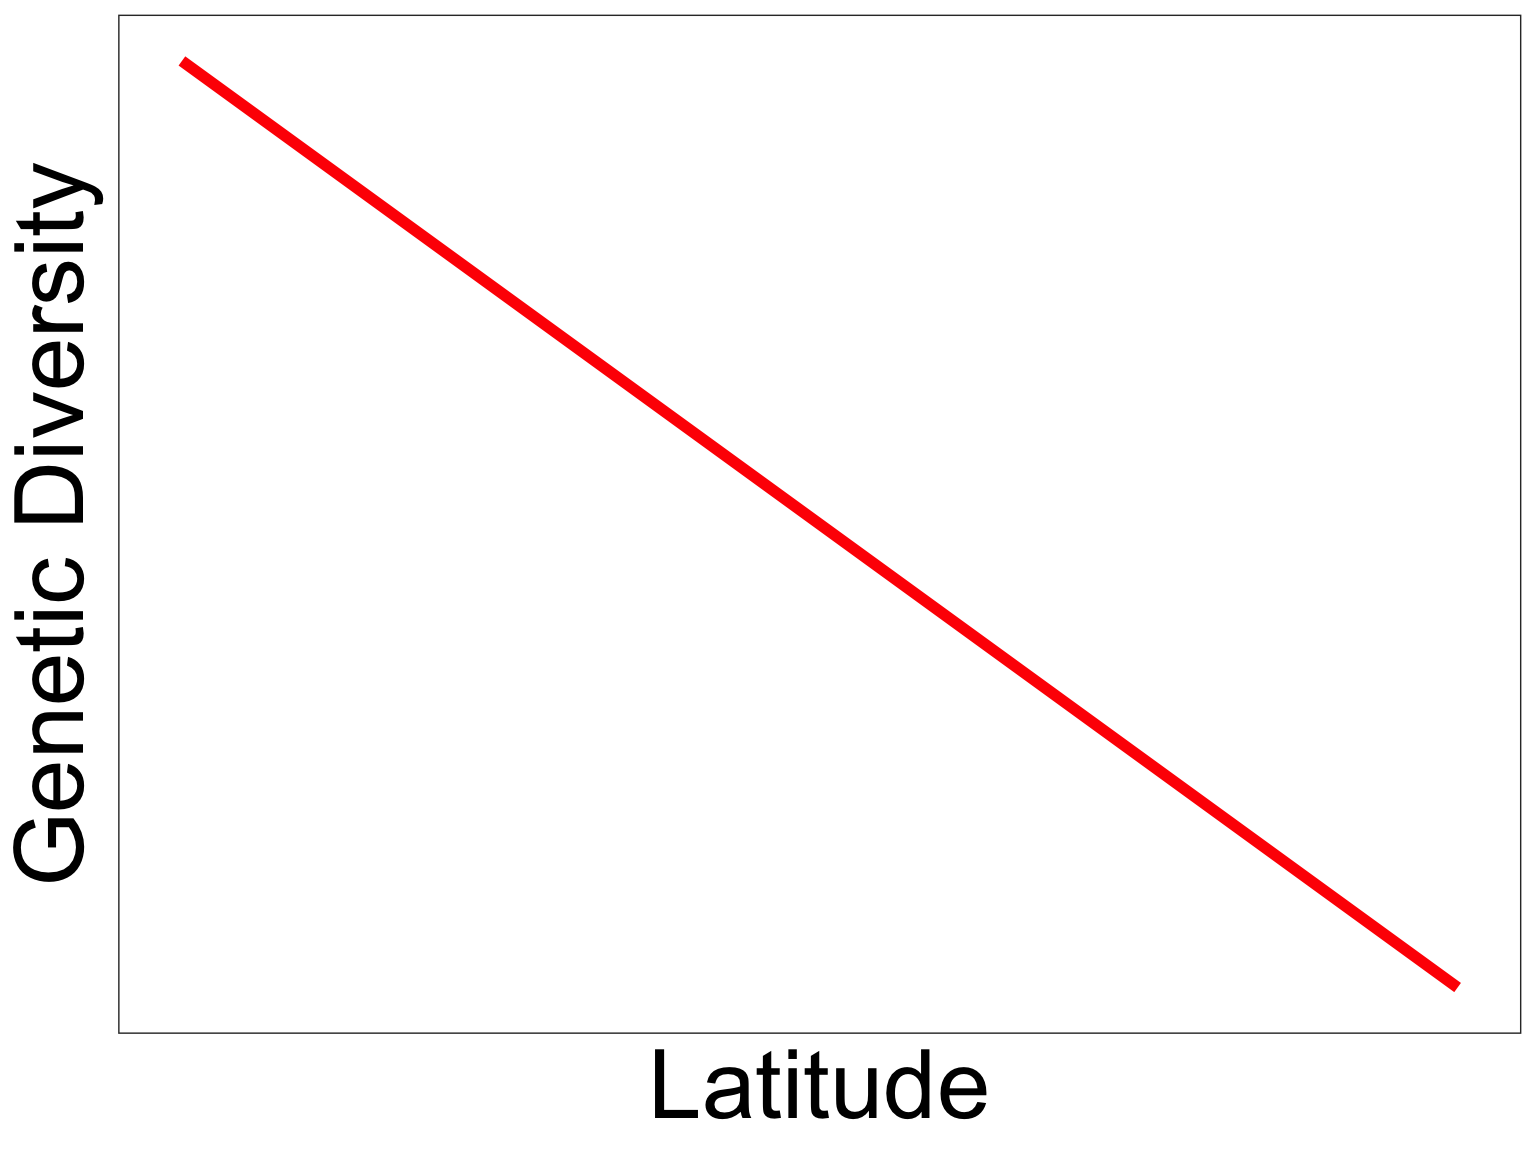
Latitudinal diversity gradient 1
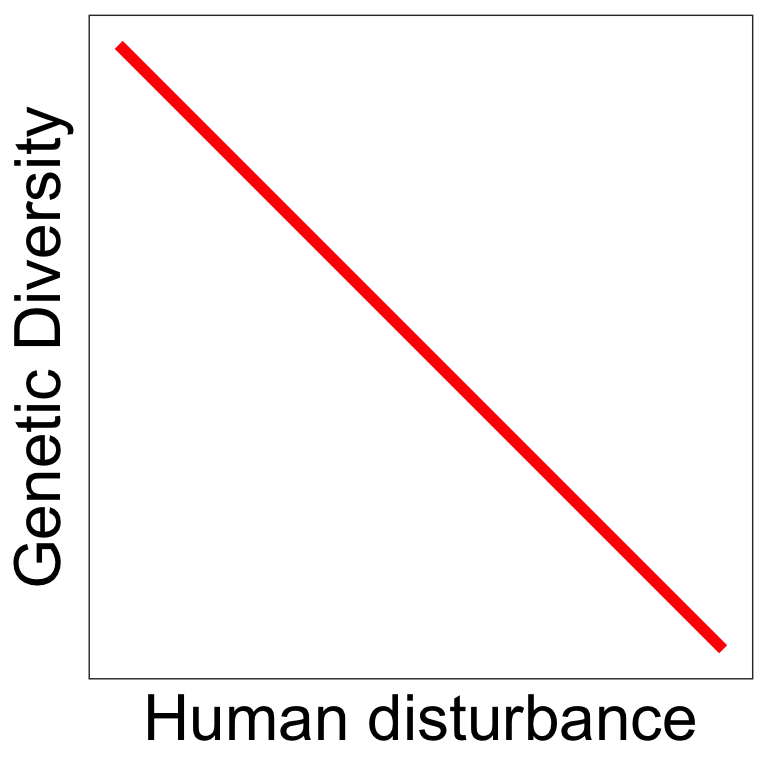
Human disturbance 2
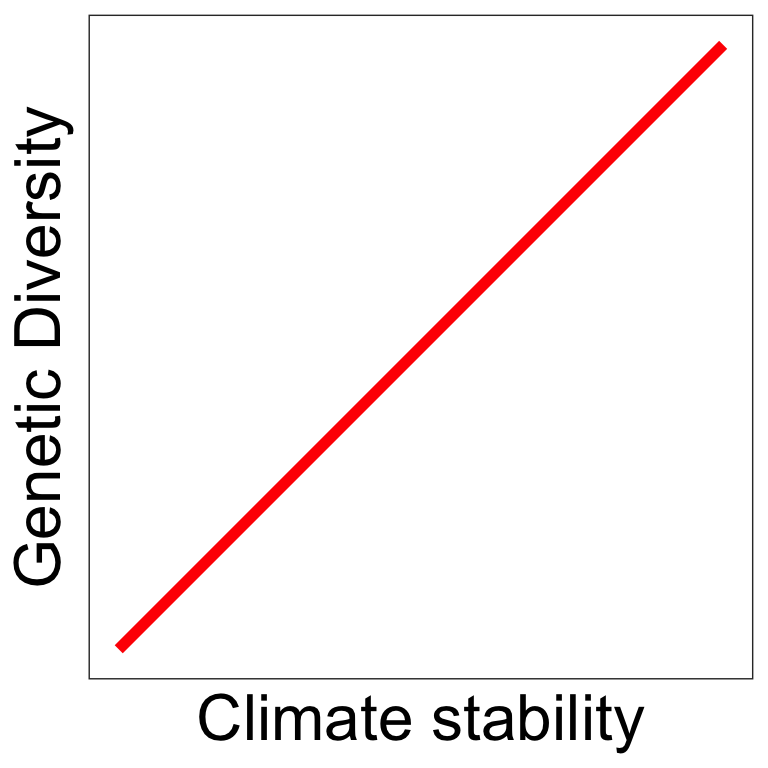
Climate stability 3
I compiled the largest animal macrogenetic dataset to date
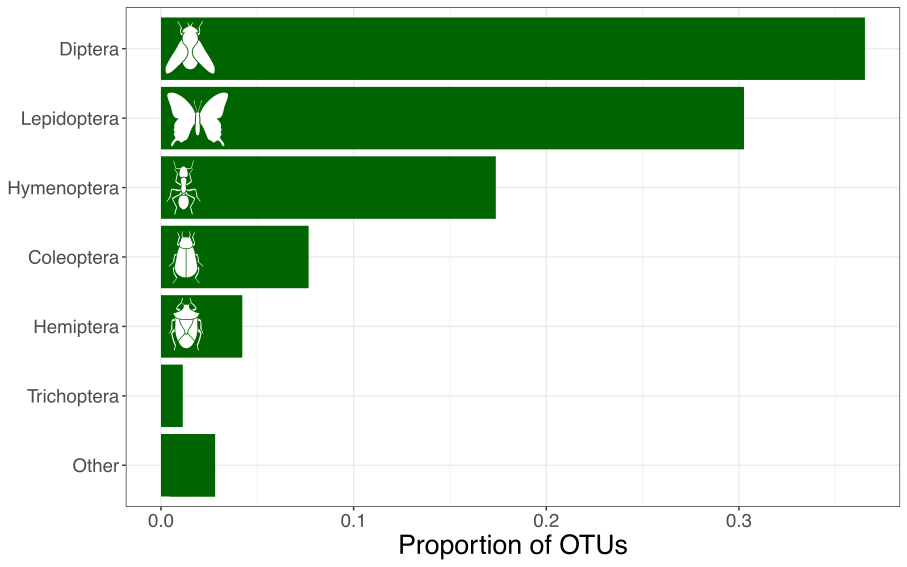

Summarizing genetic diversity
For each OTU, I calculated the mean number of pairwise differences between sequences

Genetic diversity mean (GDM) = the average genetic diversity among all OTUs
Genetic diversity evenness (GDE) = the evenness of genetic diversity across OTUs
High GDE -> more OTUs with a similar level of genetic diversity
Low GDE -> OTUs have very different levels of genetic diversity
Global maps of insect genetic diversity evenness


GDE peaks in the subtropics
Prediction
GDE peaks in the subtropics
Observation

GDE peaks in the subtropics
- Rapoport’s rule: species ranges are larger at higher latitudes 1
- Genetic diversity tends to increase with range size 2
- Pattern breaks down in previously glaciated regions
GDE is correlated with current climate and climate stability
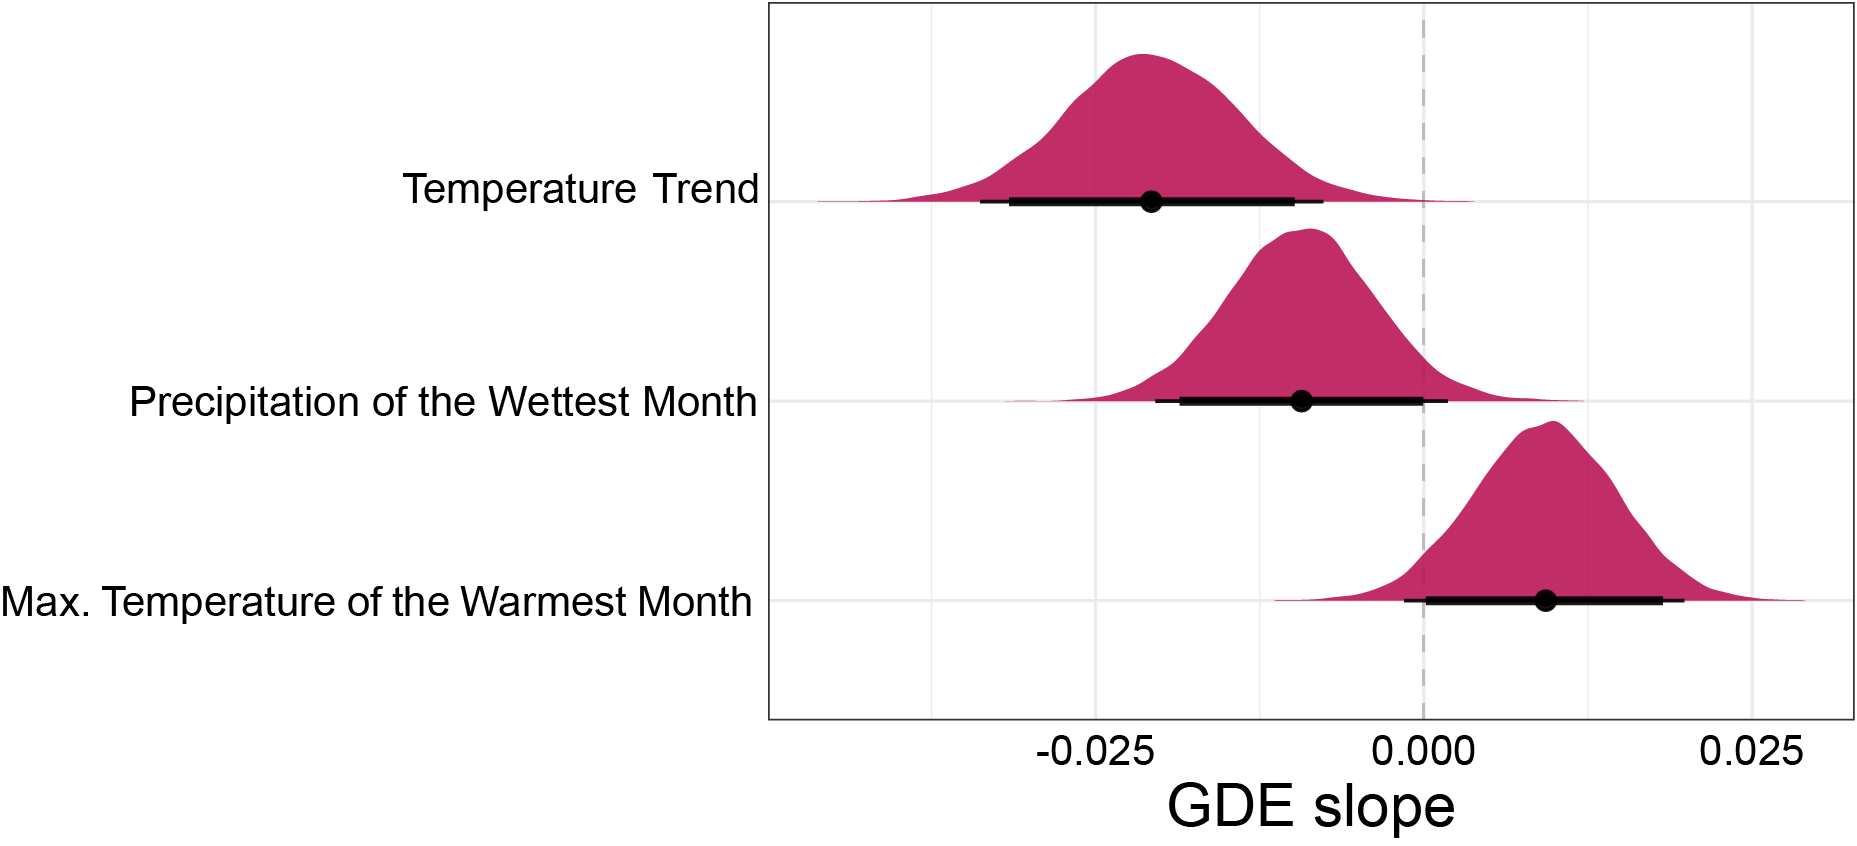
GDE is correlated with current climate and climate stability
- Climate stability hypothesis: genetic diversity increases with climate stability 1
- Evolutionary speed hypothesis: genetic diversity increases with temperature 2
- Insect diapause provides an adaptive tolerance to seasonal temperature variation 3
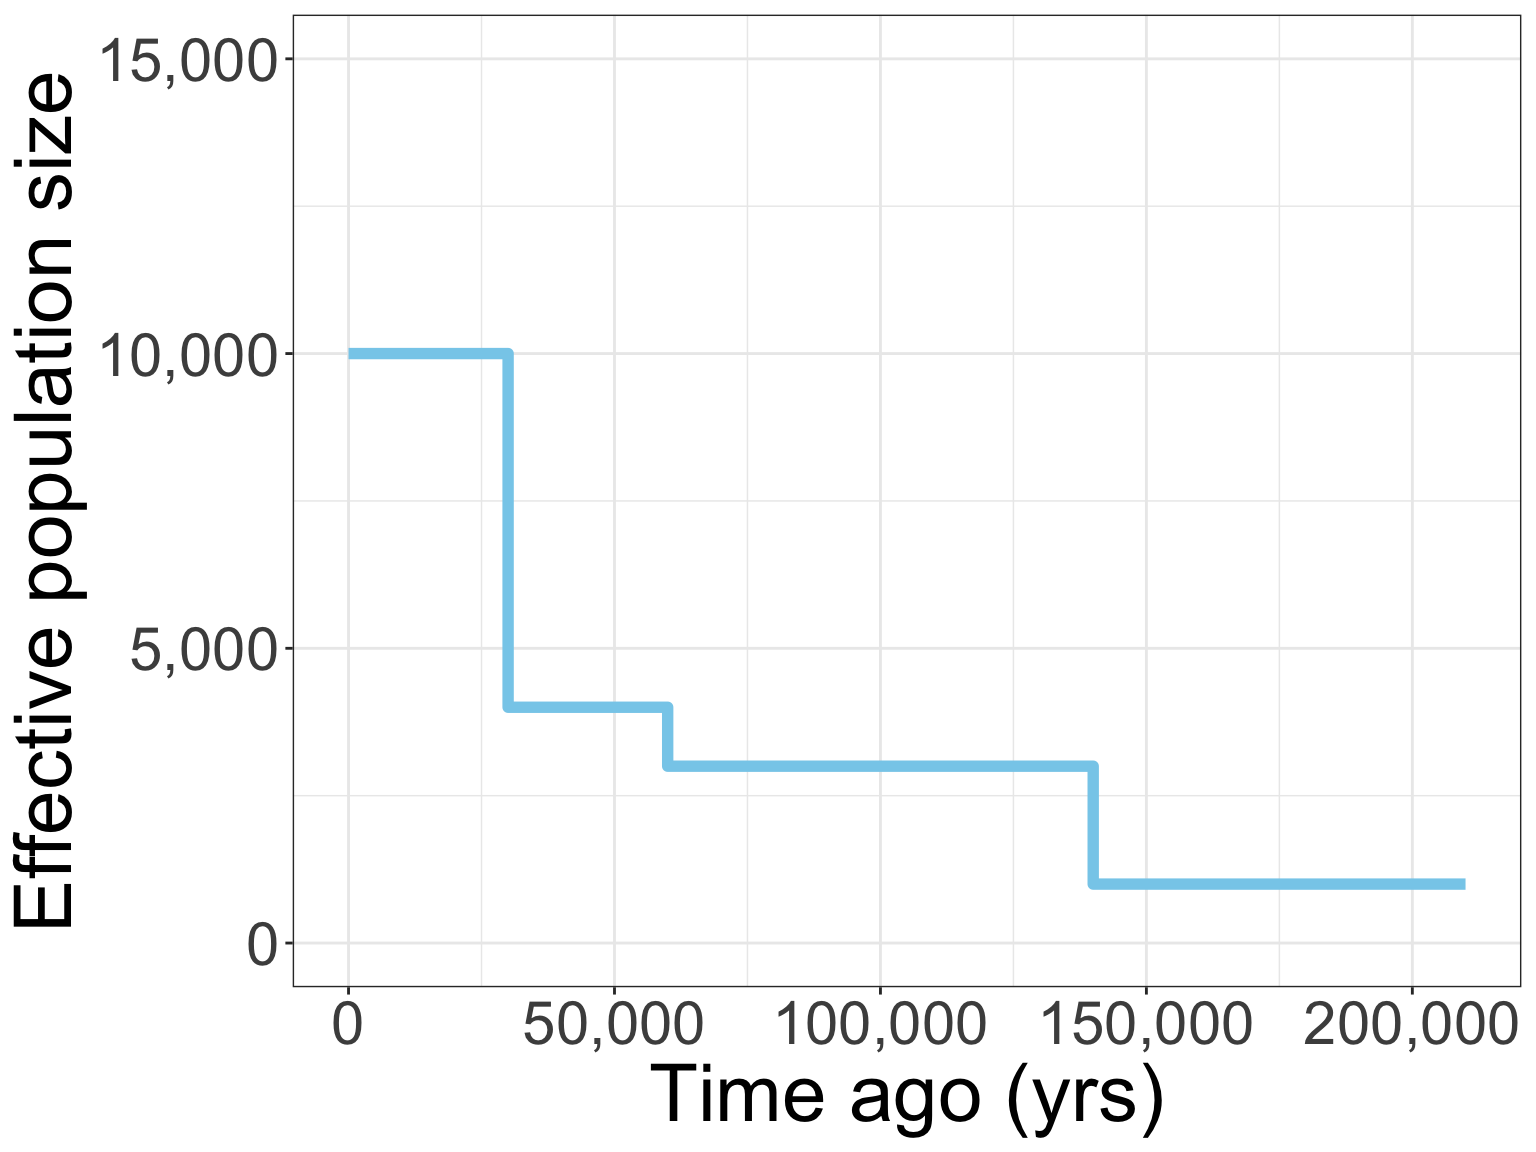
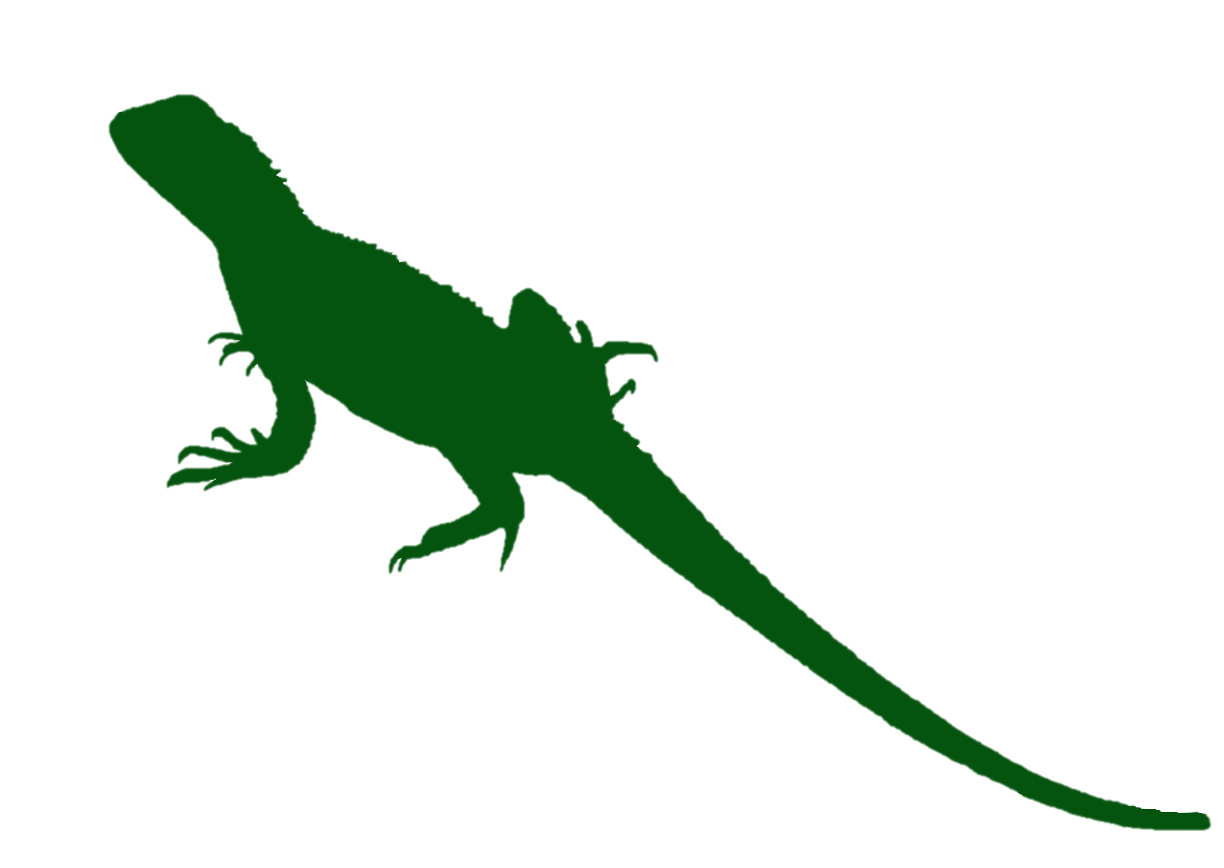
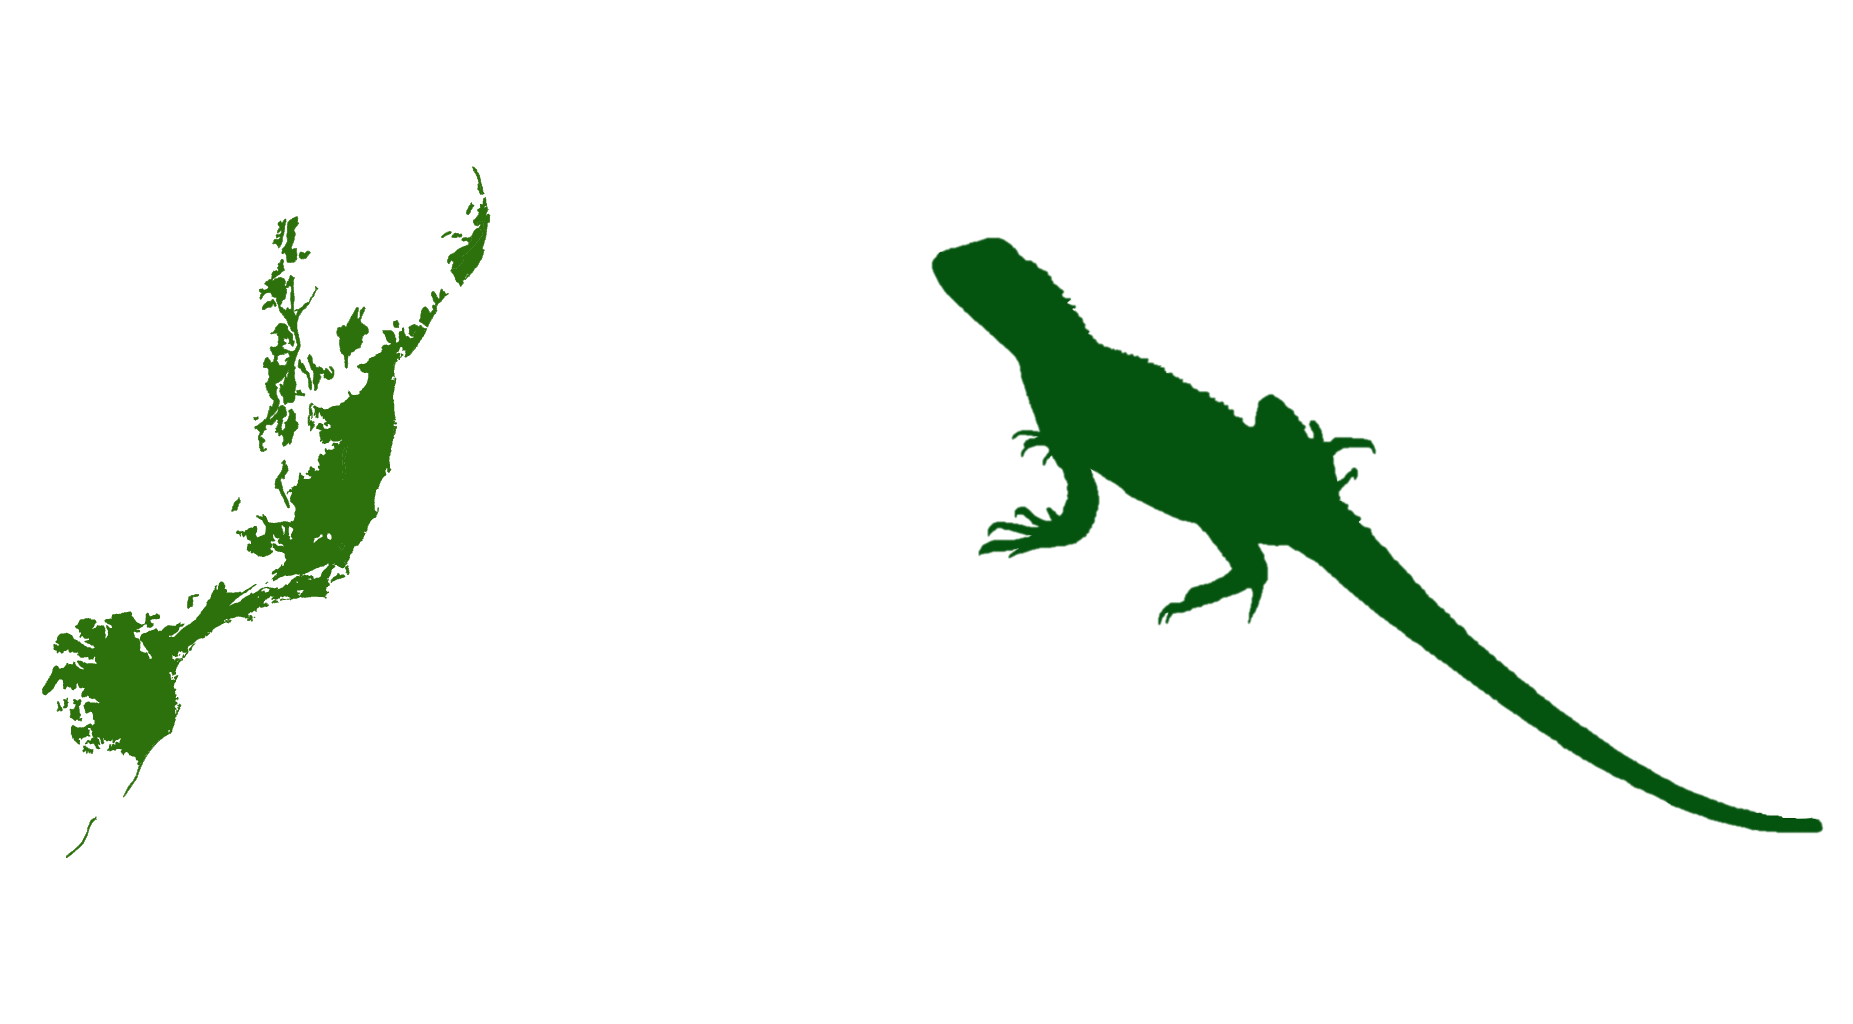
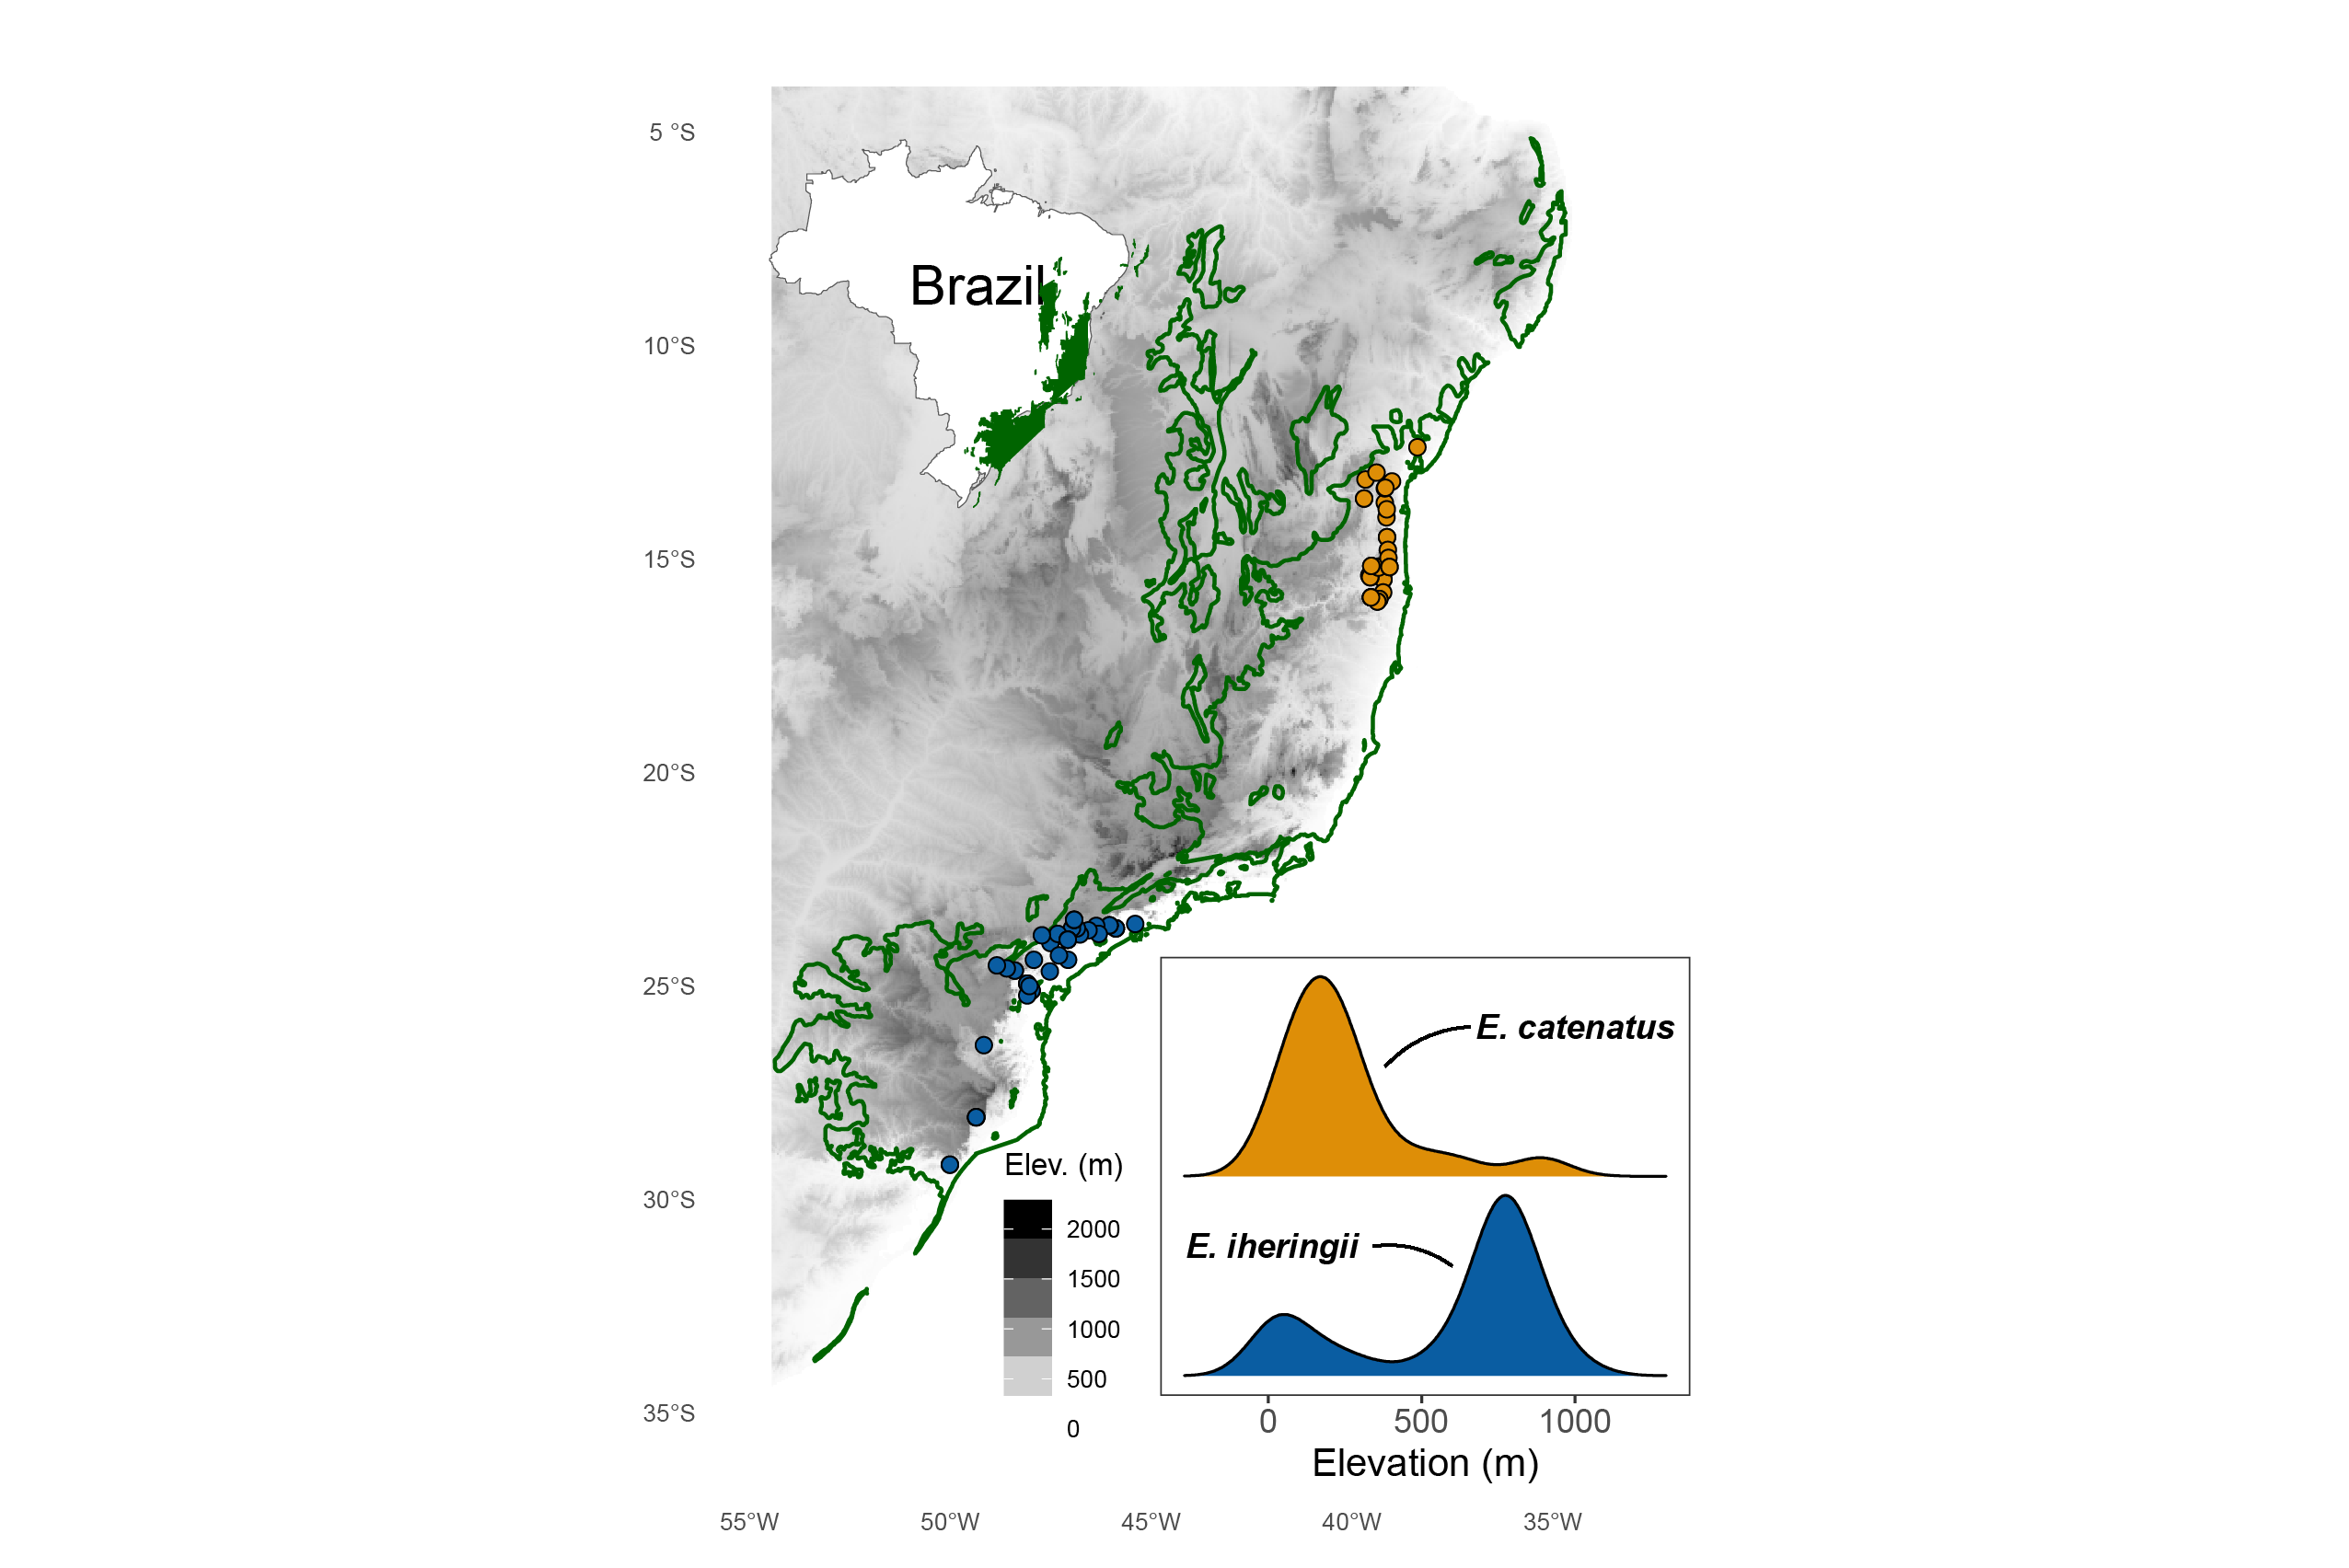
Demographic responses to past climate change in Brazilian Enyalius lizards using spatially-explicit coalescent modeling
Macro-scale patterns are interesting…


but what about processes?

Species are expected to respond differently to environmental change
 1
1
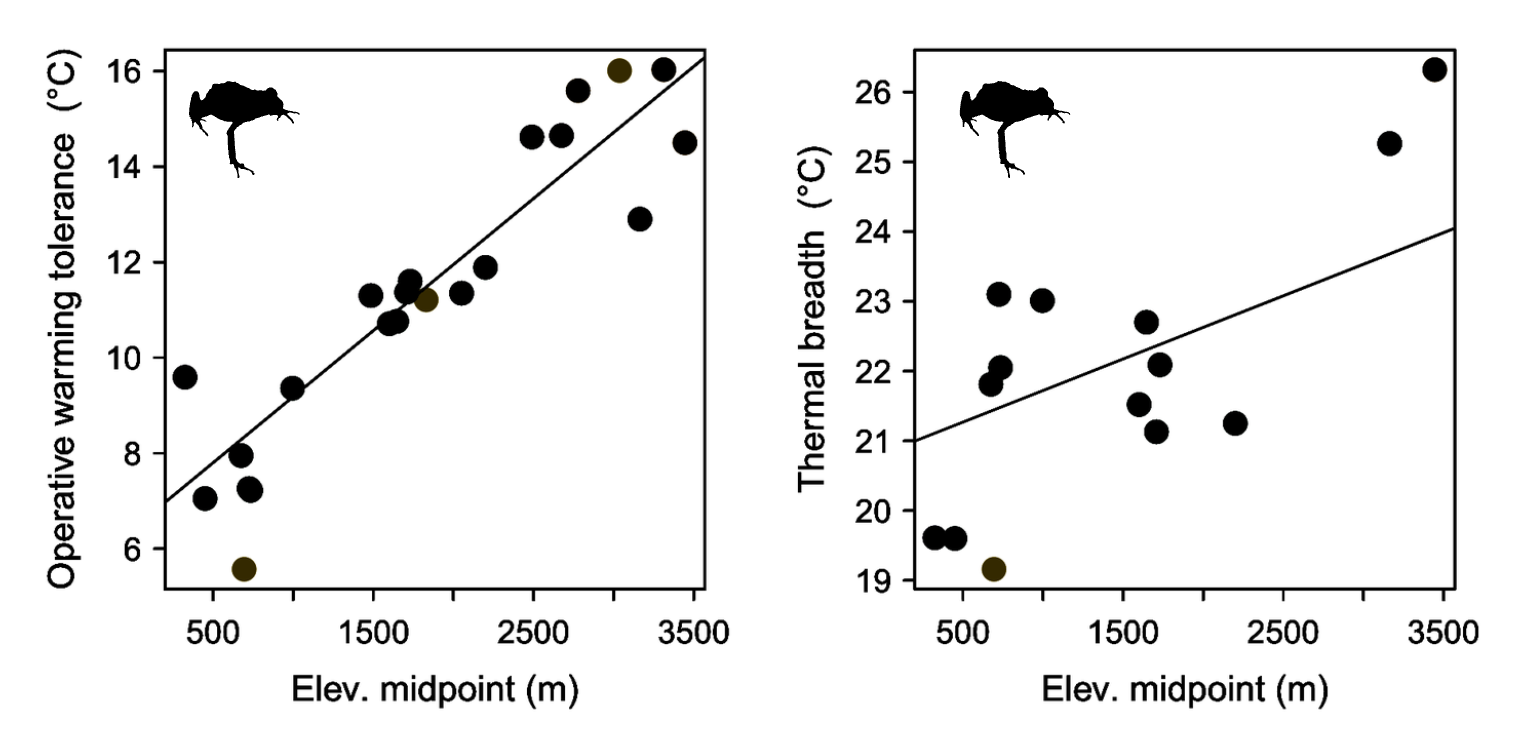
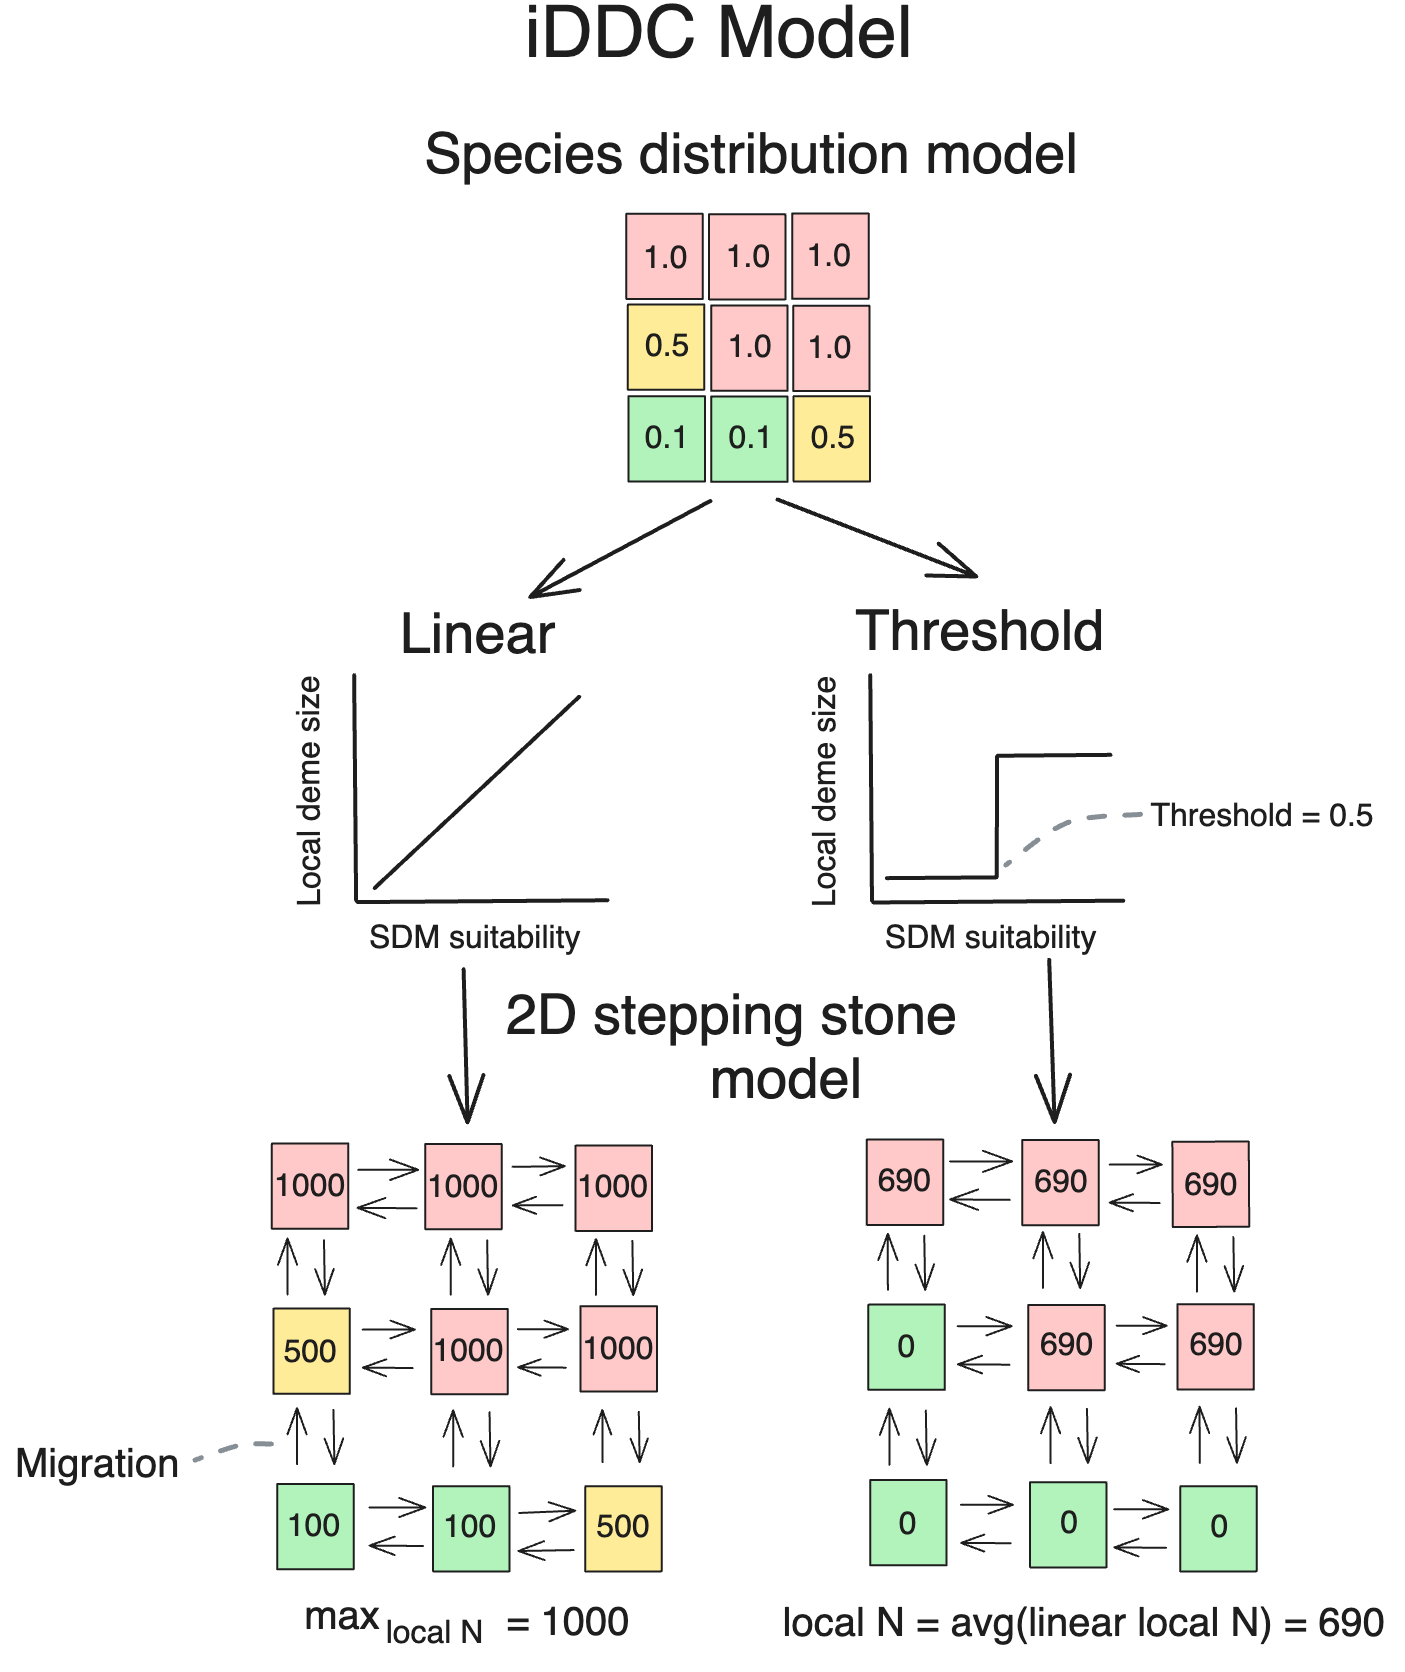
Species distribution models (SDMs) are useful tools

SDM suitabilities may have a non-linear relationship with abundance in high-elevation species

I investigate this relationship in two lizard species


Predictions

Predictions

I used simulations and machine learning to test these hypotheses


Local deme size?
Migration rate?


A threshold transformation is more likely for the high-elevation species
Predictions
A threshold transformation is more likely for the high-elevation species
Observations

Migration is estimated to be higher for the high-elevation species
Predictions
Migration is estimated to be higher for the high-elevation species
Observations


![]()
a Python package to facilitate spatially-explicit coalescent models in msprime
Simulating these complex scenarios is difficult
space
Take spatial models of habitat suitability (i.e. SDMs) projected through time

prime
Simulate the genealogy of a sample of DNA sequences backwards in time with
![]()
The spaceprime website (will) contain
- Documentation of all functions
- A quickstart guide and worked example(s)
![]()
- A guide for R users
- FAQ and other resources
Thank you! Questions?
